Fig. 12.
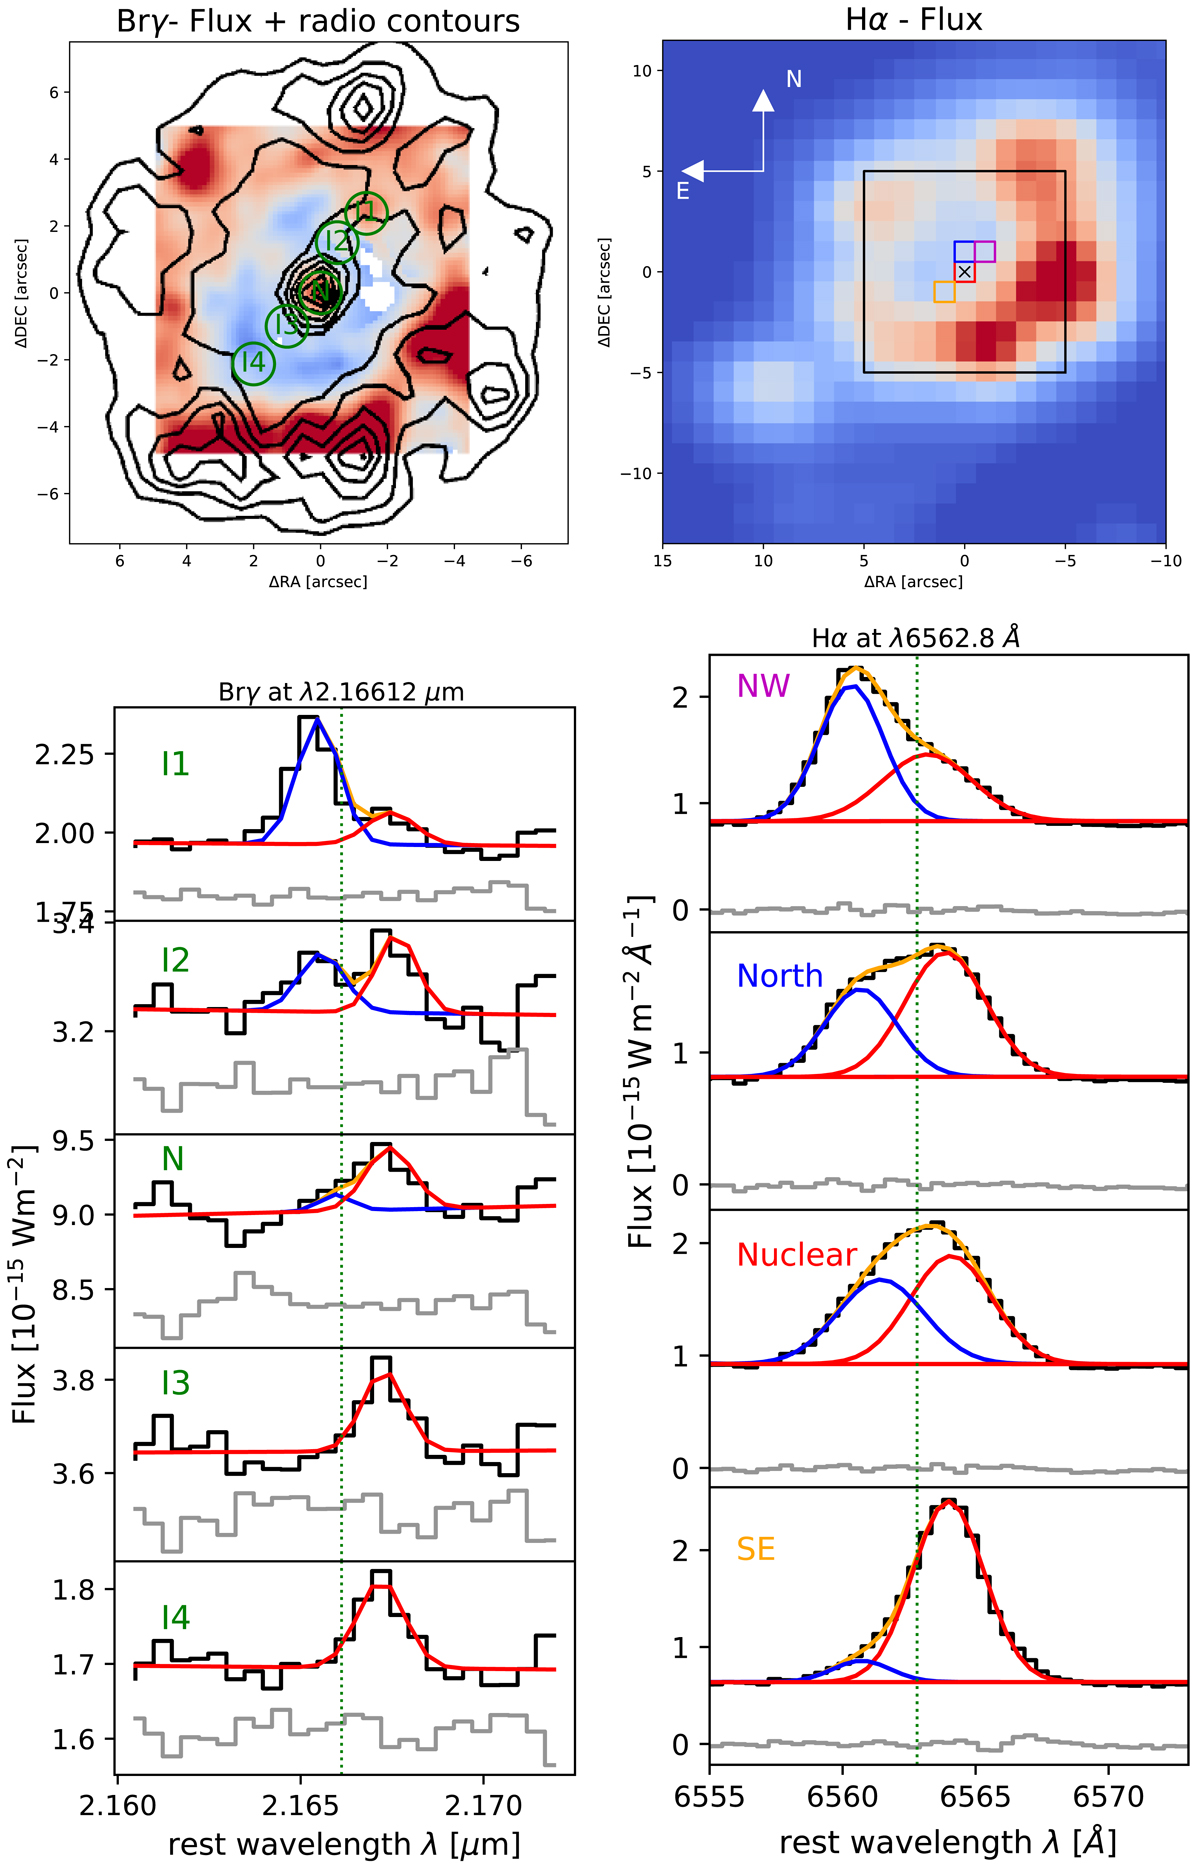
Top left: flux map of the emission line Brγ λ2.16612 μm. Overlaid are the radio contours from Jenkins et al. (2011), which have an angular resolution of ![]() . Bottom left: spectra near λ = 2.16612 μm extracted from apertures I1-4 and N indicated in the flux map from north-west to south-east of the nucleus. For the I1-2 and N apertures at nucleus and to its north-west a line split is detected and a double-component Gaussian is used to fit the emission line. Top right: flux map of the emission line Hα λ6562.8. Bottom right: spectra of Hα from the apertures indicated in the emission line flux map with spectral and angular resolutions of R = 7000 and 1″ (Dopita et al. 2015), respectively; the spectra are extracted from 1″ × 1″ pixels. The green dotted lines show the rest wavelength of the emission lines. At the nucleus and NW a line split is detected and the emission lines need to be fitted with two-component Gaussian profiles (data from S7; Thomas et al. 2017).
. Bottom left: spectra near λ = 2.16612 μm extracted from apertures I1-4 and N indicated in the flux map from north-west to south-east of the nucleus. For the I1-2 and N apertures at nucleus and to its north-west a line split is detected and a double-component Gaussian is used to fit the emission line. Top right: flux map of the emission line Hα λ6562.8. Bottom right: spectra of Hα from the apertures indicated in the emission line flux map with spectral and angular resolutions of R = 7000 and 1″ (Dopita et al. 2015), respectively; the spectra are extracted from 1″ × 1″ pixels. The green dotted lines show the rest wavelength of the emission lines. At the nucleus and NW a line split is detected and the emission lines need to be fitted with two-component Gaussian profiles (data from S7; Thomas et al. 2017).
Current usage metrics show cumulative count of Article Views (full-text article views including HTML views, PDF and ePub downloads, according to the available data) and Abstracts Views on Vision4Press platform.
Data correspond to usage on the plateform after 2015. The current usage metrics is available 48-96 hours after online publication and is updated daily on week days.
Initial download of the metrics may take a while.