Fig. 10.
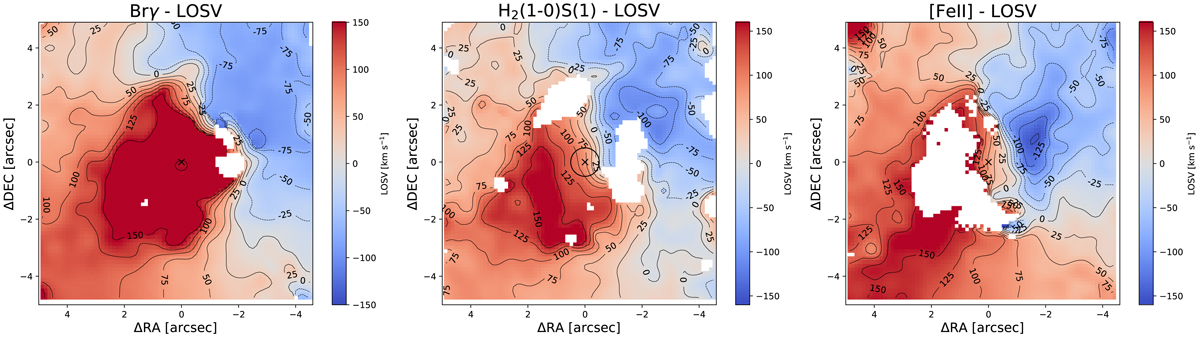
Gas velocity fields, results of fitting Brγ, H2(1–0)S(1)λ2.122 μm, and [Fe II]λ1.644 μm emission lines. The black cross denotes the nucleus, where the continuum flux peaks. The circle in the H2 map indicates the central arcsec where Combes et al. (2019) found a molecular torus. All velocities are given relative to the systemic velocity of 1392 km s−1. North is up and east is to the left.
Current usage metrics show cumulative count of Article Views (full-text article views including HTML views, PDF and ePub downloads, according to the available data) and Abstracts Views on Vision4Press platform.
Data correspond to usage on the plateform after 2015. The current usage metrics is available 48-96 hours after online publication and is updated daily on week days.
Initial download of the metrics may take a while.