Fig. 8
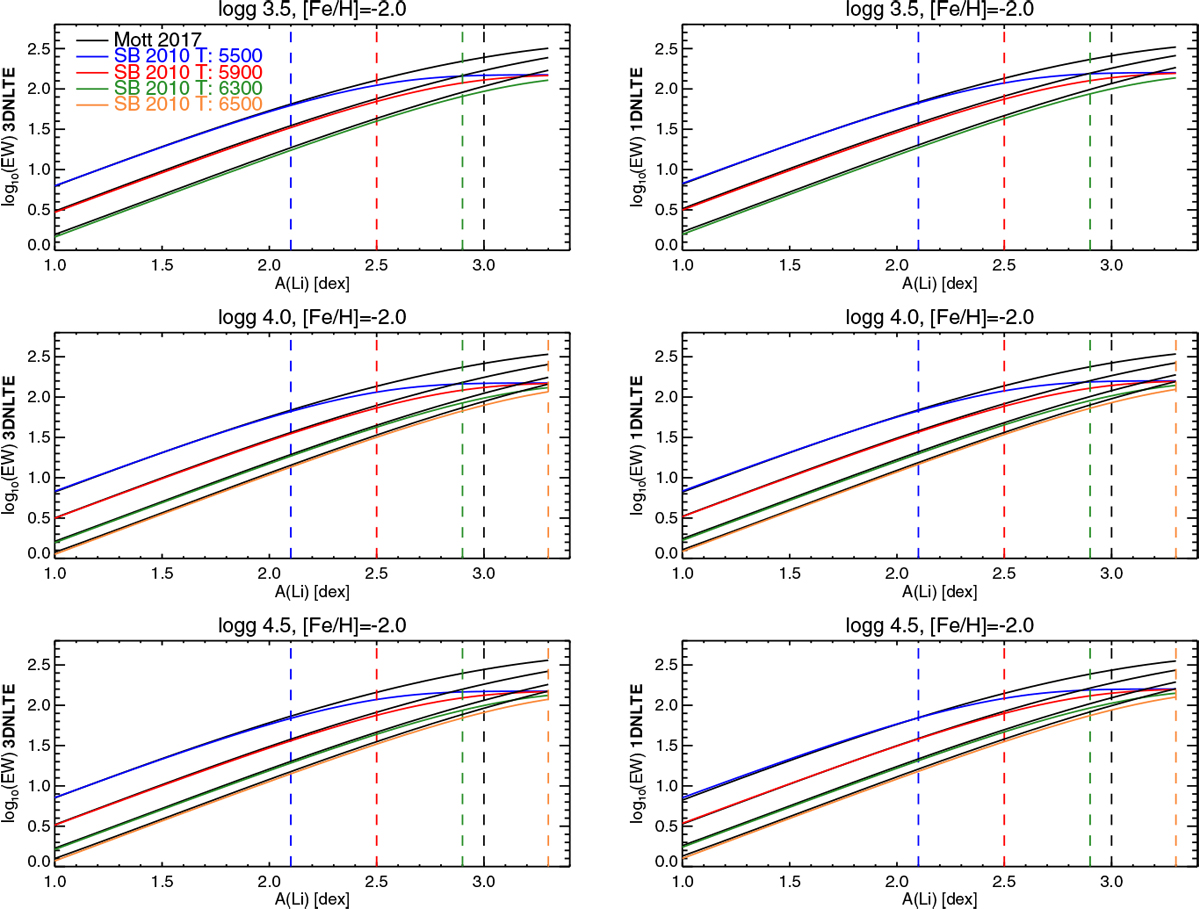
Comparison between the Li 670.8 nm curves-of-growth computed with the fitting function of Sbordone et al. (2010) for [Fe∕H] = − 2.0 (colored continuous lines) and with our function FFII (black solid lines) for the 3D NLTE (left) and 1D NLTE (right) cases, respectively, and for three values of surface gravity (log g = 3.5, 4.0, and 4.5). The vertical colored dashed lines indicate the upper limits of the lithium abundance range for which the relation of Sbordone et al. (2010) is well defined (beyond these limits the fitting function is evaluated in extrapolation). Different colors denote the different effective temperatures at which the relations are evaluated (see legend in upper left panel). The black dashed line represents the upper abundance limit up to which our fitting function is defined (A(Li) = 3.0 for all temperatures).
Current usage metrics show cumulative count of Article Views (full-text article views including HTML views, PDF and ePub downloads, according to the available data) and Abstracts Views on Vision4Press platform.
Data correspond to usage on the plateform after 2015. The current usage metrics is available 48-96 hours after online publication and is updated daily on week days.
Initial download of the metrics may take a while.