Fig. 7
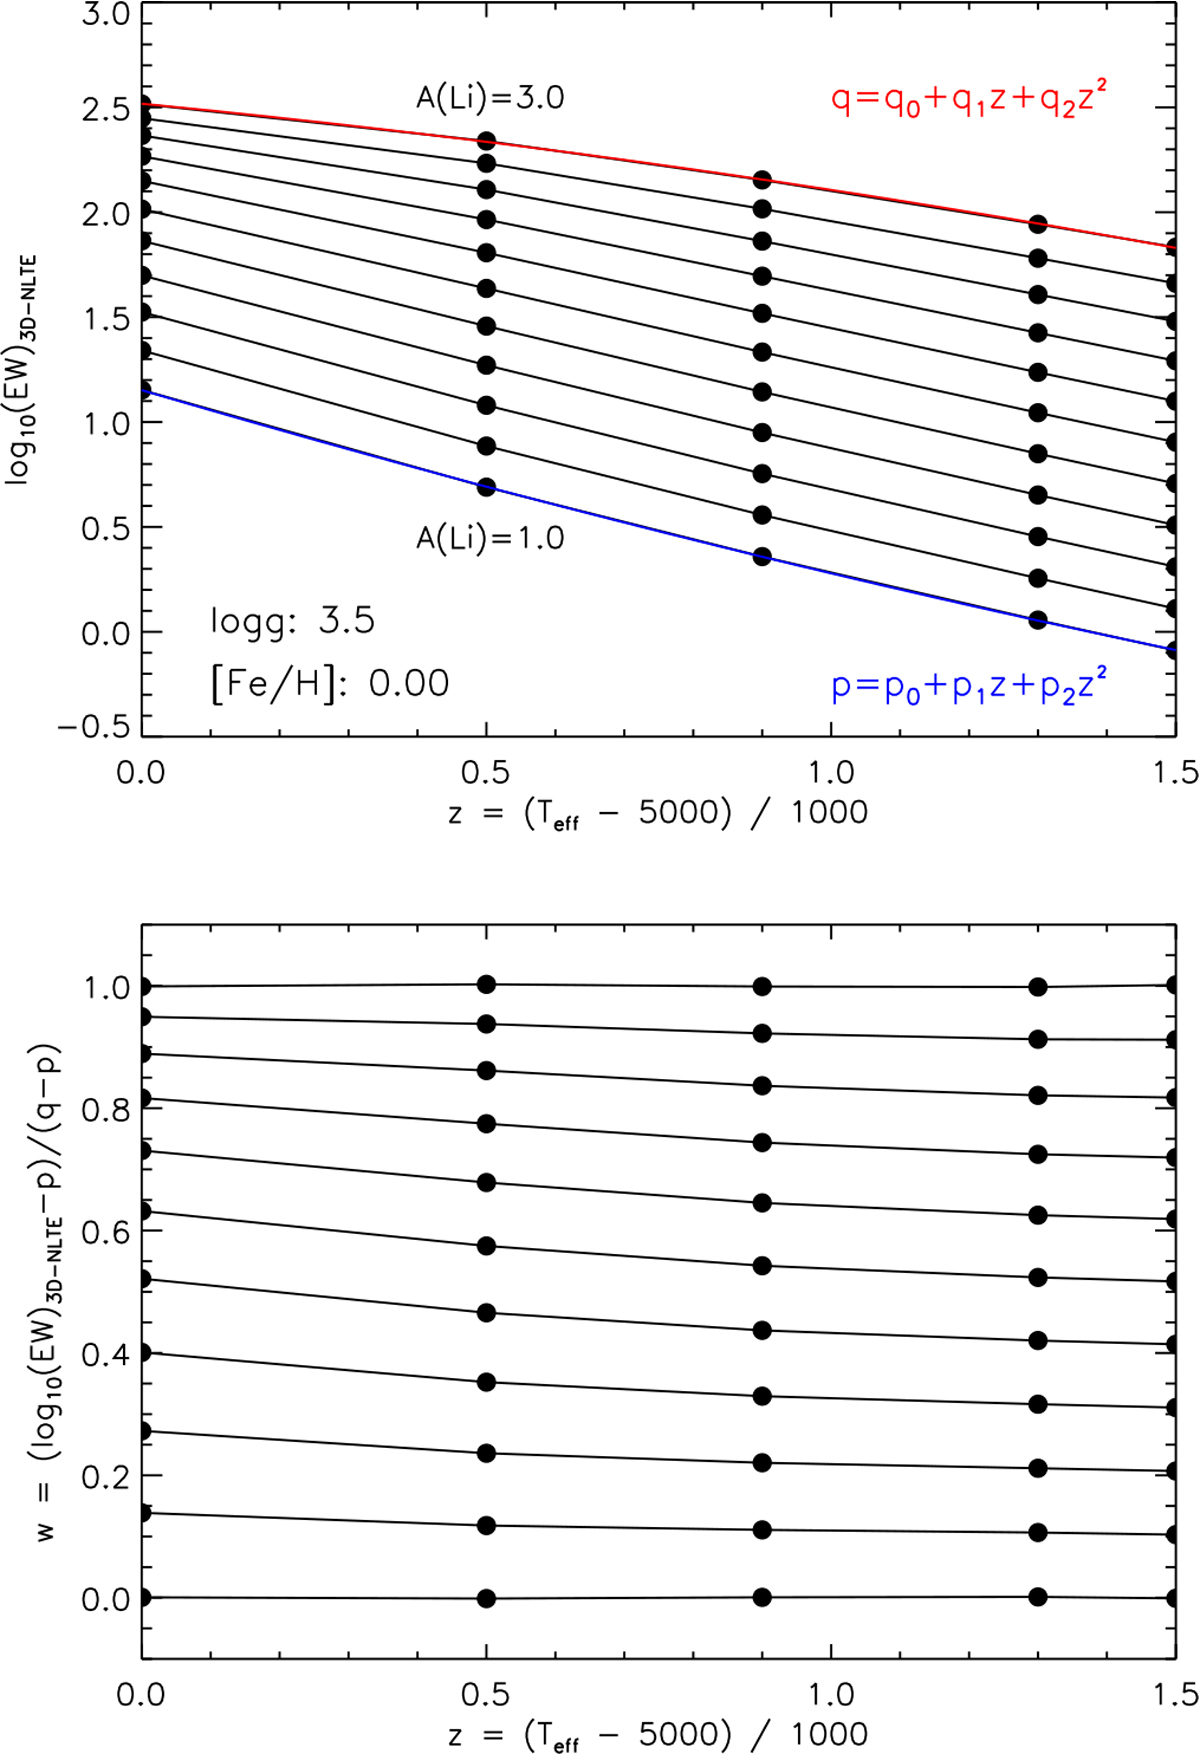
Distribution of the 3D NLTE data points for log g = 3.5, [Fe∕H] = 0.0 in the Teff – EW plane (upper panel), and in the Teff – w plane (lower panel) where the systematic trend with temperature is eliminated by normalizing the EWs with the help of the parabolic boundary curves p(z) and q(z) shown in the upper panel (see text for details).
Current usage metrics show cumulative count of Article Views (full-text article views including HTML views, PDF and ePub downloads, according to the available data) and Abstracts Views on Vision4Press platform.
Data correspond to usage on the plateform after 2015. The current usage metrics is available 48-96 hours after online publication and is updated daily on week days.
Initial download of the metrics may take a while.