Fig. 3
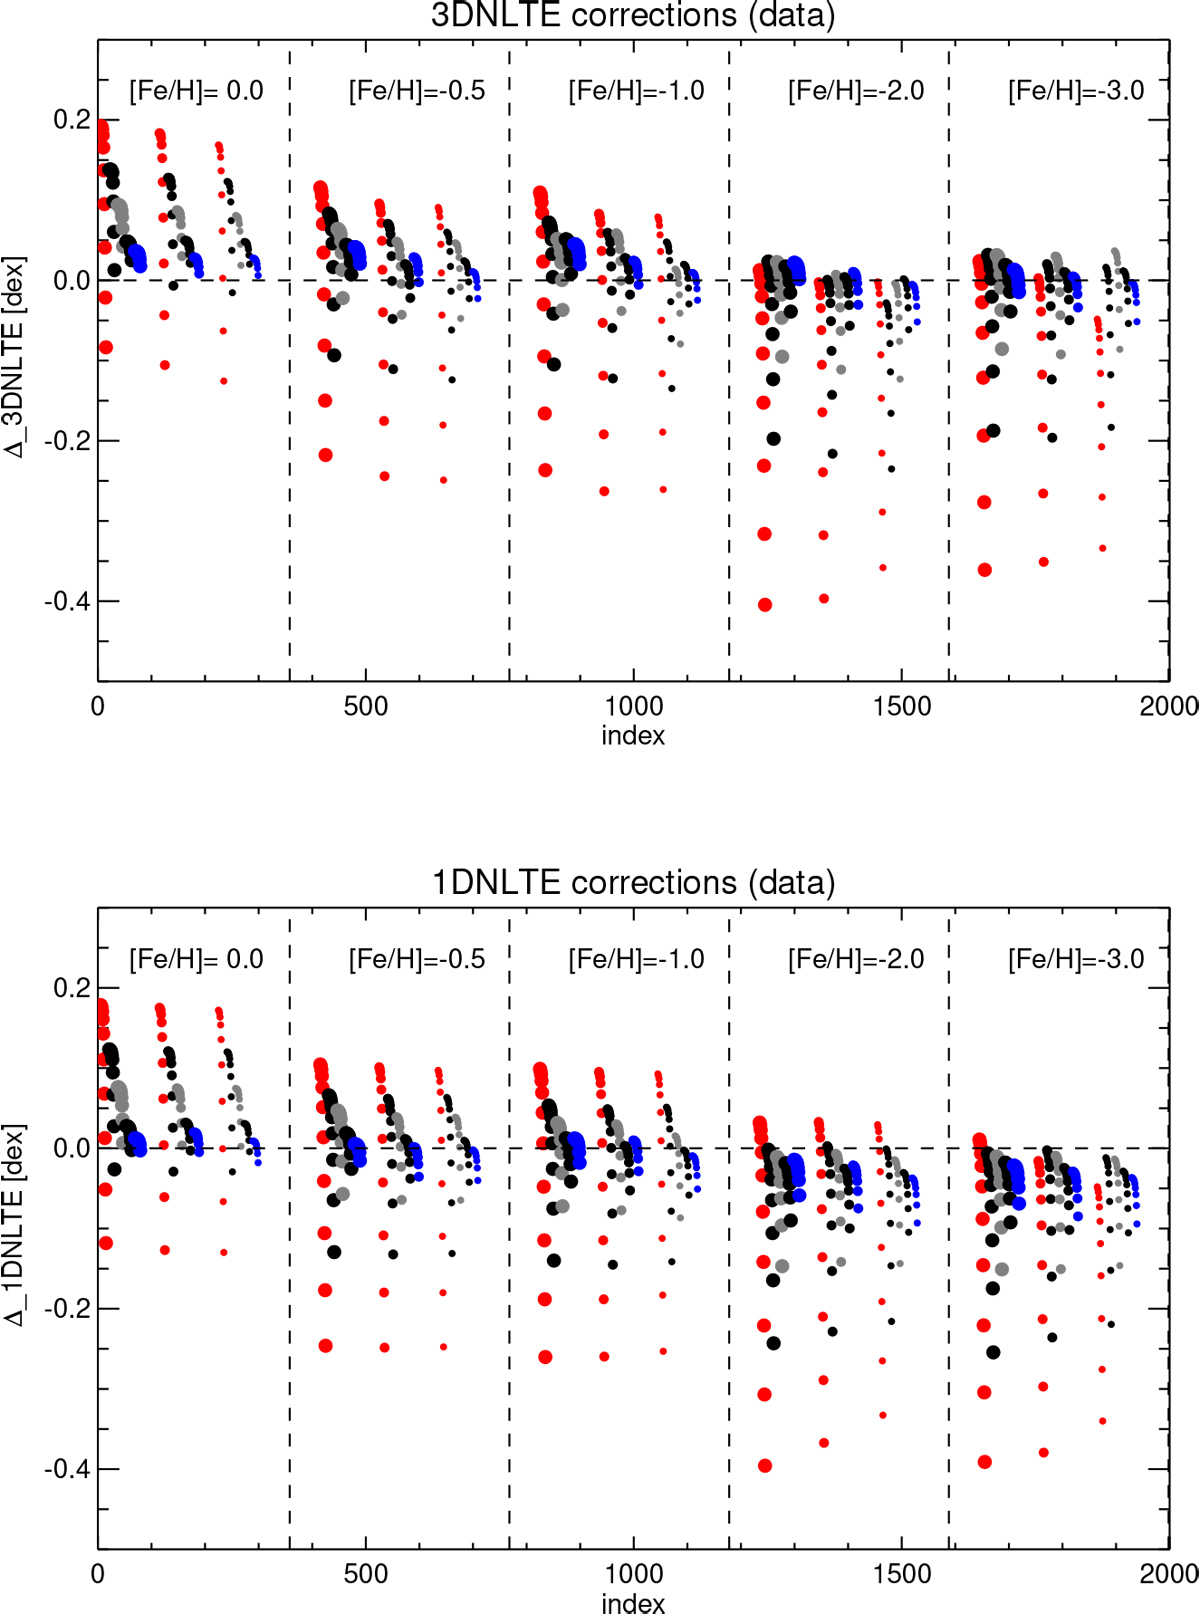
Overview of the Li abundance corrections Δ3DNLTE-1DLTE (top) and Δ1DNLTE-1DLTE (bottom) as evaluated on the complete 4D parameter grid. For each metallicity, a total of 165 points indicates the corrections as a function of an arbitrary spectrum number that runs over A(Li), Teff, and log g. Large (left group), intermediate (middle group), and small dots (right group) correspond to log g = 3.5, 4.0, and 4.5, respectively. For each gravity, Teff increases from left to right (5000 K: red, 5500 K: black, 5900 K: gray, 6300 K: black, 6500 K: blue). Each effective temperature is represented by 11 dots indicating the results for 1.0 ≤ A(Li) ≤ 3.0.
Current usage metrics show cumulative count of Article Views (full-text article views including HTML views, PDF and ePub downloads, according to the available data) and Abstracts Views on Vision4Press platform.
Data correspond to usage on the plateform after 2015. The current usage metrics is available 48-96 hours after online publication and is updated daily on week days.
Initial download of the metrics may take a while.