Fig. B.4
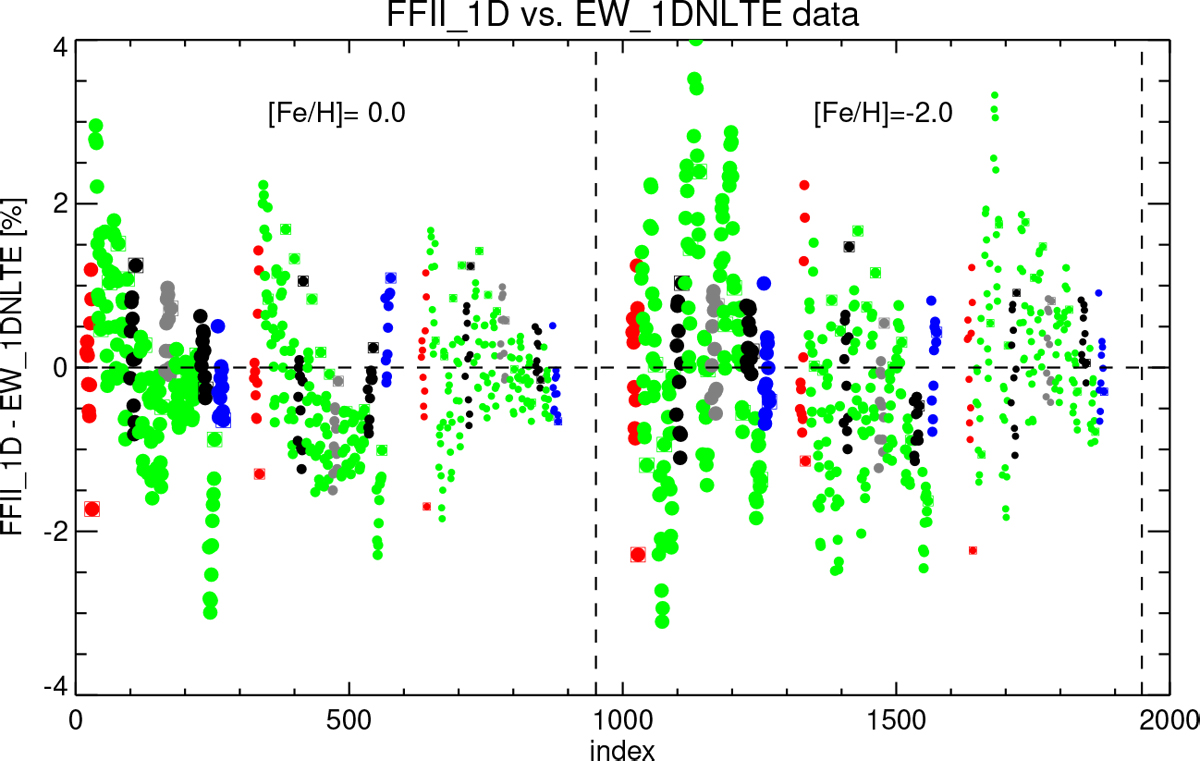
Partial view of Fig. B.3 (bottom), showing for metallicities [Fe/H] = 0.0 and −2.0 the difference (FFII1DNLTE− input EW) as a function of spectrum number, now for a refined temperature grid with ΔTeff = 100 K. For each metallicity, large, intermediate, and small dots correspond to log g = 3.5, 4.0, and 4.5, respectively. For each gravity, Teff increases from left to right. Color coding for the temperatures of the original grid is the same as in Fig. B.3; in addition, green dots represent the results for the intermediate 1D LHD test models. As before, each effective temperature is represented by 10 dots for 1.0 ≤ A(Li) ≤ 2.8 plus a square for A(Li) = 3.0.
Current usage metrics show cumulative count of Article Views (full-text article views including HTML views, PDF and ePub downloads, according to the available data) and Abstracts Views on Vision4Press platform.
Data correspond to usage on the plateform after 2015. The current usage metrics is available 48-96 hours after online publication and is updated daily on week days.
Initial download of the metrics may take a while.