Fig. 2
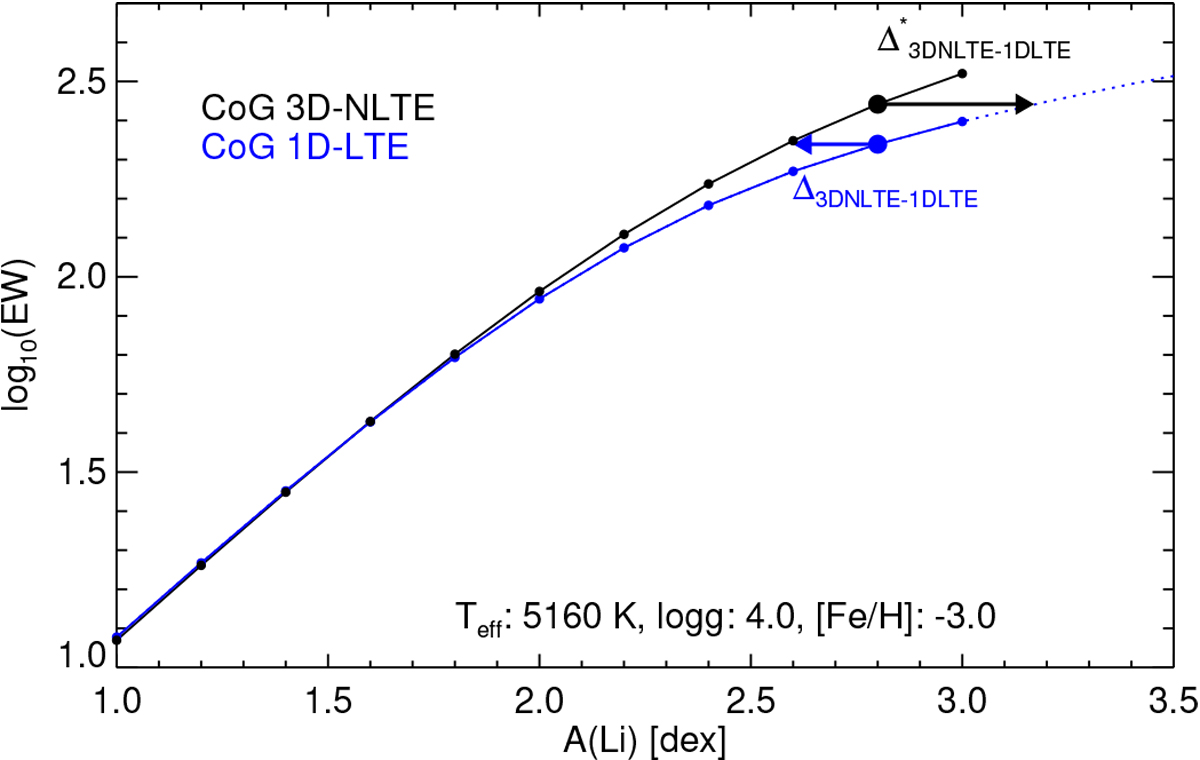
Two different definitions of abundance corrections for the example of a strong Li line on the non-linear part of the CoG. The correction ![]() is indicated by the black horizontal arrow starting on the 3D NLTE CoG (black) at
A(Li) = 2.8 and ending at a higher abundance given by the intersection with the 1D LTE CoG (blue). Conversely, the correction
Δ3DNLTE-1DLTE
is given by the blue horizontal arrow starting on the 1D LTE CoG (blue) at the same abundance
A(Li) = 2.8 and extending to the 3D NLTE CoG (black).
is indicated by the black horizontal arrow starting on the 3D NLTE CoG (black) at
A(Li) = 2.8 and ending at a higher abundance given by the intersection with the 1D LTE CoG (blue). Conversely, the correction
Δ3DNLTE-1DLTE
is given by the blue horizontal arrow starting on the 1D LTE CoG (blue) at the same abundance
A(Li) = 2.8 and extending to the 3D NLTE CoG (black).
Current usage metrics show cumulative count of Article Views (full-text article views including HTML views, PDF and ePub downloads, according to the available data) and Abstracts Views on Vision4Press platform.
Data correspond to usage on the plateform after 2015. The current usage metrics is available 48-96 hours after online publication and is updated daily on week days.
Initial download of the metrics may take a while.