Fig. 10
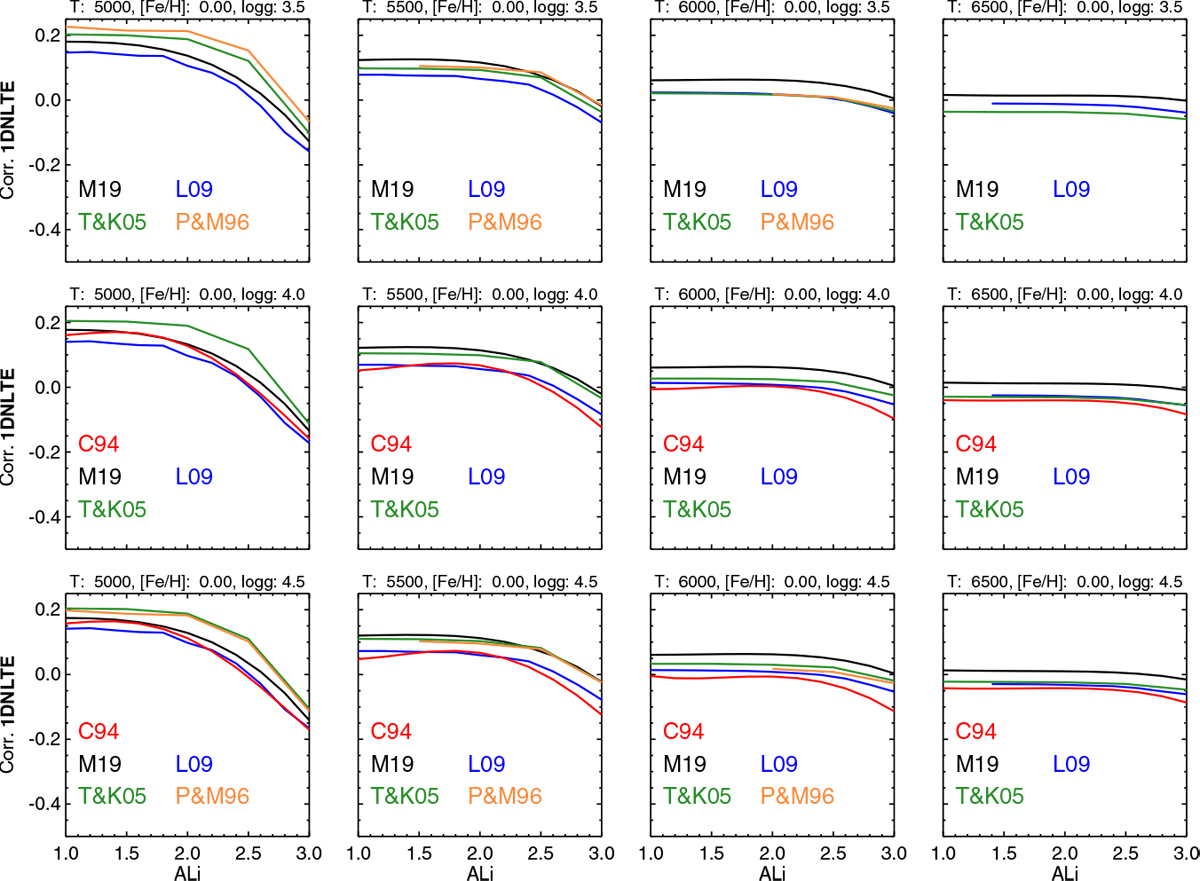
Comparison between the results of our fitting function FFI for the 1D NLTE lithium abundance corrections and those published by other authors for [Fe∕H] = 0.0, log g = 3.5, 4.0, and 4.5, Teff = 5000, 5500, 6000, and 6500 K. The black lines labeled as M19 show our results, whereas the colored lines show the corrections of other authors: C94 (Carlsson et al. 1994, red), P&M96 (Pavlenko & Magazzu 1996, orange), T&K05 (Takeda & Kawanomoto 2005, green), and L09 (Lind et al. 2009, blue).
Current usage metrics show cumulative count of Article Views (full-text article views including HTML views, PDF and ePub downloads, according to the available data) and Abstracts Views on Vision4Press platform.
Data correspond to usage on the plateform after 2015. The current usage metrics is available 48-96 hours after online publication and is updated daily on week days.
Initial download of the metrics may take a while.