Fig. 5.
Download original image
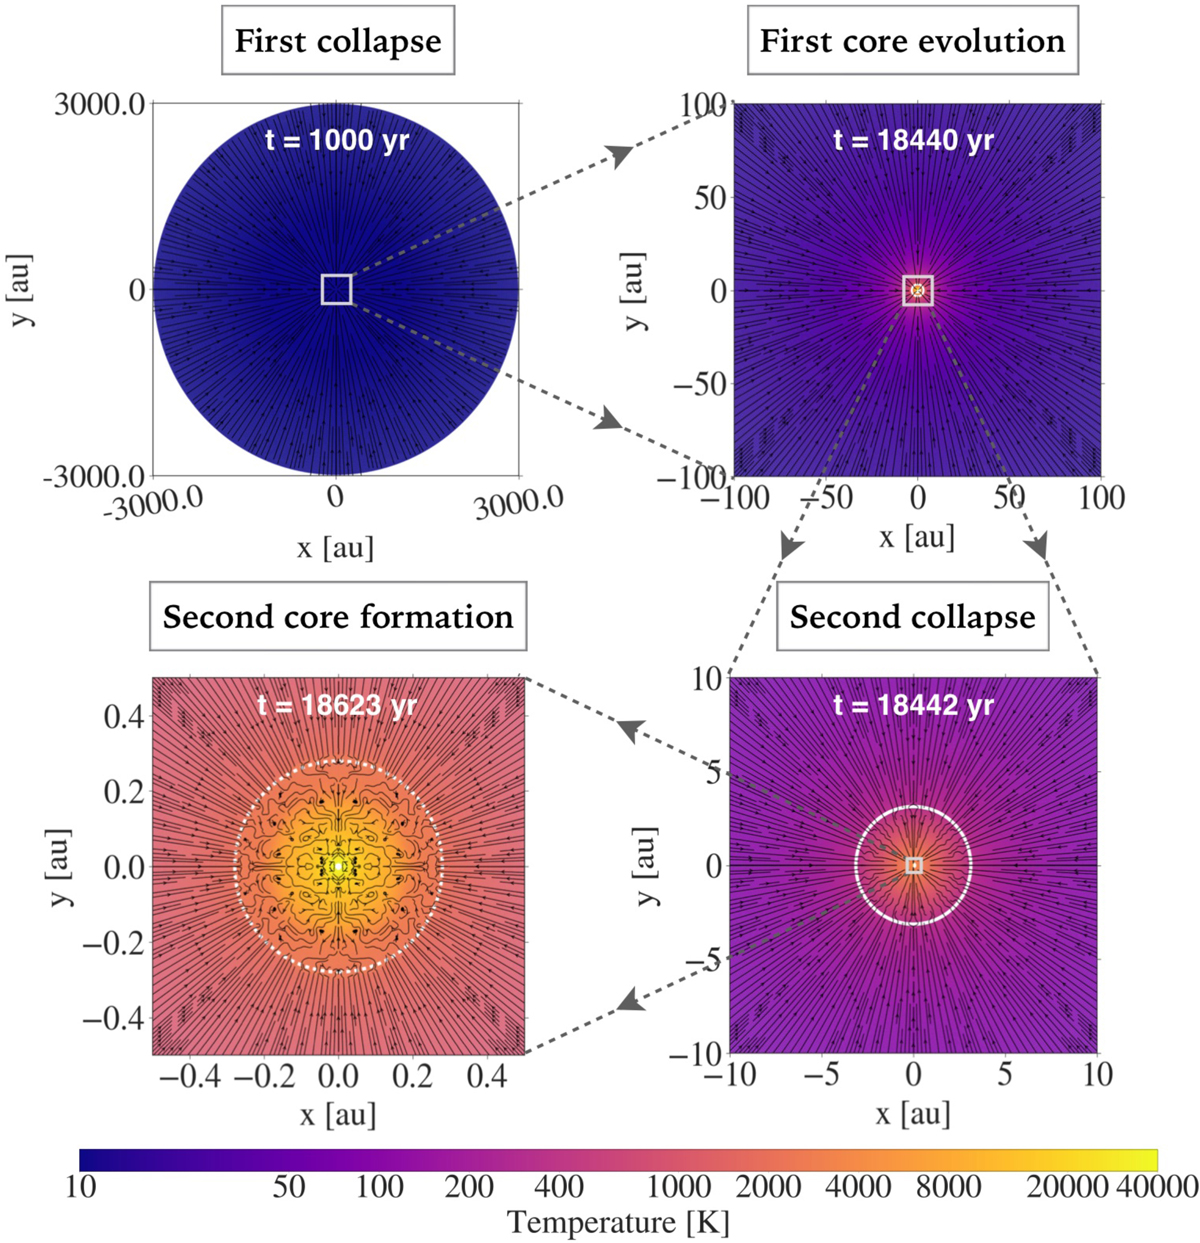
2D temperature snapshots zooming down to sub-au scales showing the evolution of a 1 M⊙ cloud core with an initial temperature of 10 K and outer radius of 3000 au. The velocity streamlines in black indicate the infalling material and also the mixing within the second core at the last snapshot. The solid and dashed white contours indicate the first and second accretion shocks, respectively. Note the different spatial scales from top left to bottom left.
Current usage metrics show cumulative count of Article Views (full-text article views including HTML views, PDF and ePub downloads, according to the available data) and Abstracts Views on Vision4Press platform.
Data correspond to usage on the plateform after 2015. The current usage metrics is available 48-96 hours after online publication and is updated daily on week days.
Initial download of the metrics may take a while.