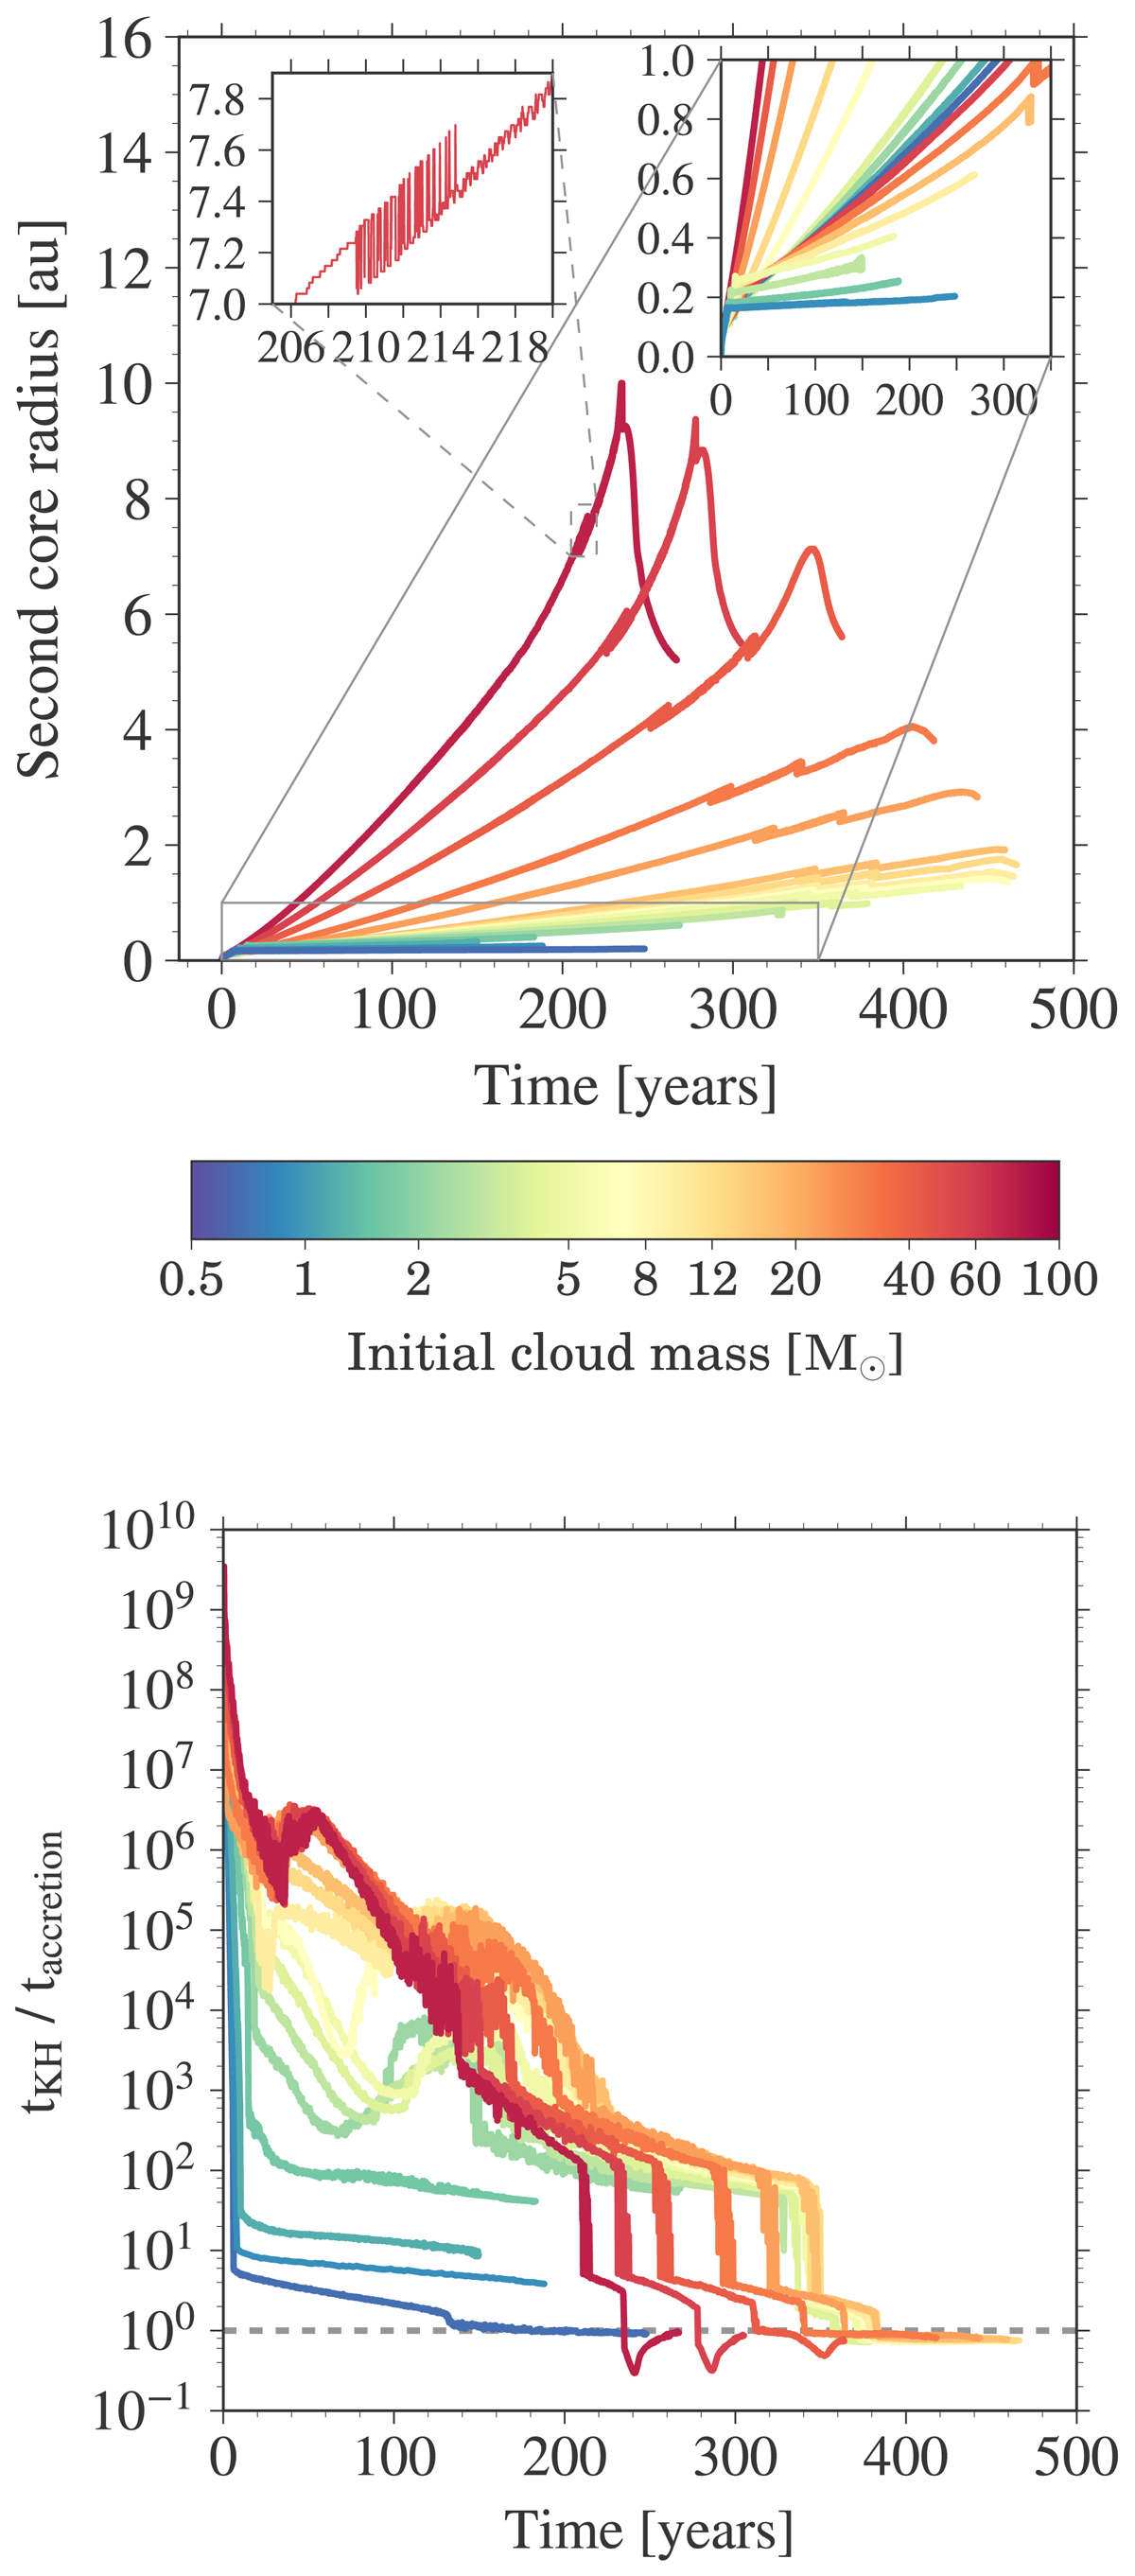
Fig. 3.
Download original image
Top: spatial evolution of the second core radius as a function of time for all the collapse scenarios with different initial cloud core masses ranging from 0.5 M⊙ to 100 M⊙ as indicated in the colour bar. The evolution is traced from the onset of the second core formation until the central density reaches ≈0.5−0.8 g cm−3. The inset in the upper left zooms in on the back and forth behaviour for one of the curves. This results from the jump between the two local minima in the velocity profile of the accretion shock, which is used to define the second core radius. Bottom: comparison of the Kelvin–Helmholtz and accretion timescales. A large (small) ratio is associated with an expansion (contraction) phase of the second hydrostatic core (see top panel).
Current usage metrics show cumulative count of Article Views (full-text article views including HTML views, PDF and ePub downloads, according to the available data) and Abstracts Views on Vision4Press platform.
Data correspond to usage on the plateform after 2015. The current usage metrics is available 48-96 hours after online publication and is updated daily on week days.
Initial download of the metrics may take a while.