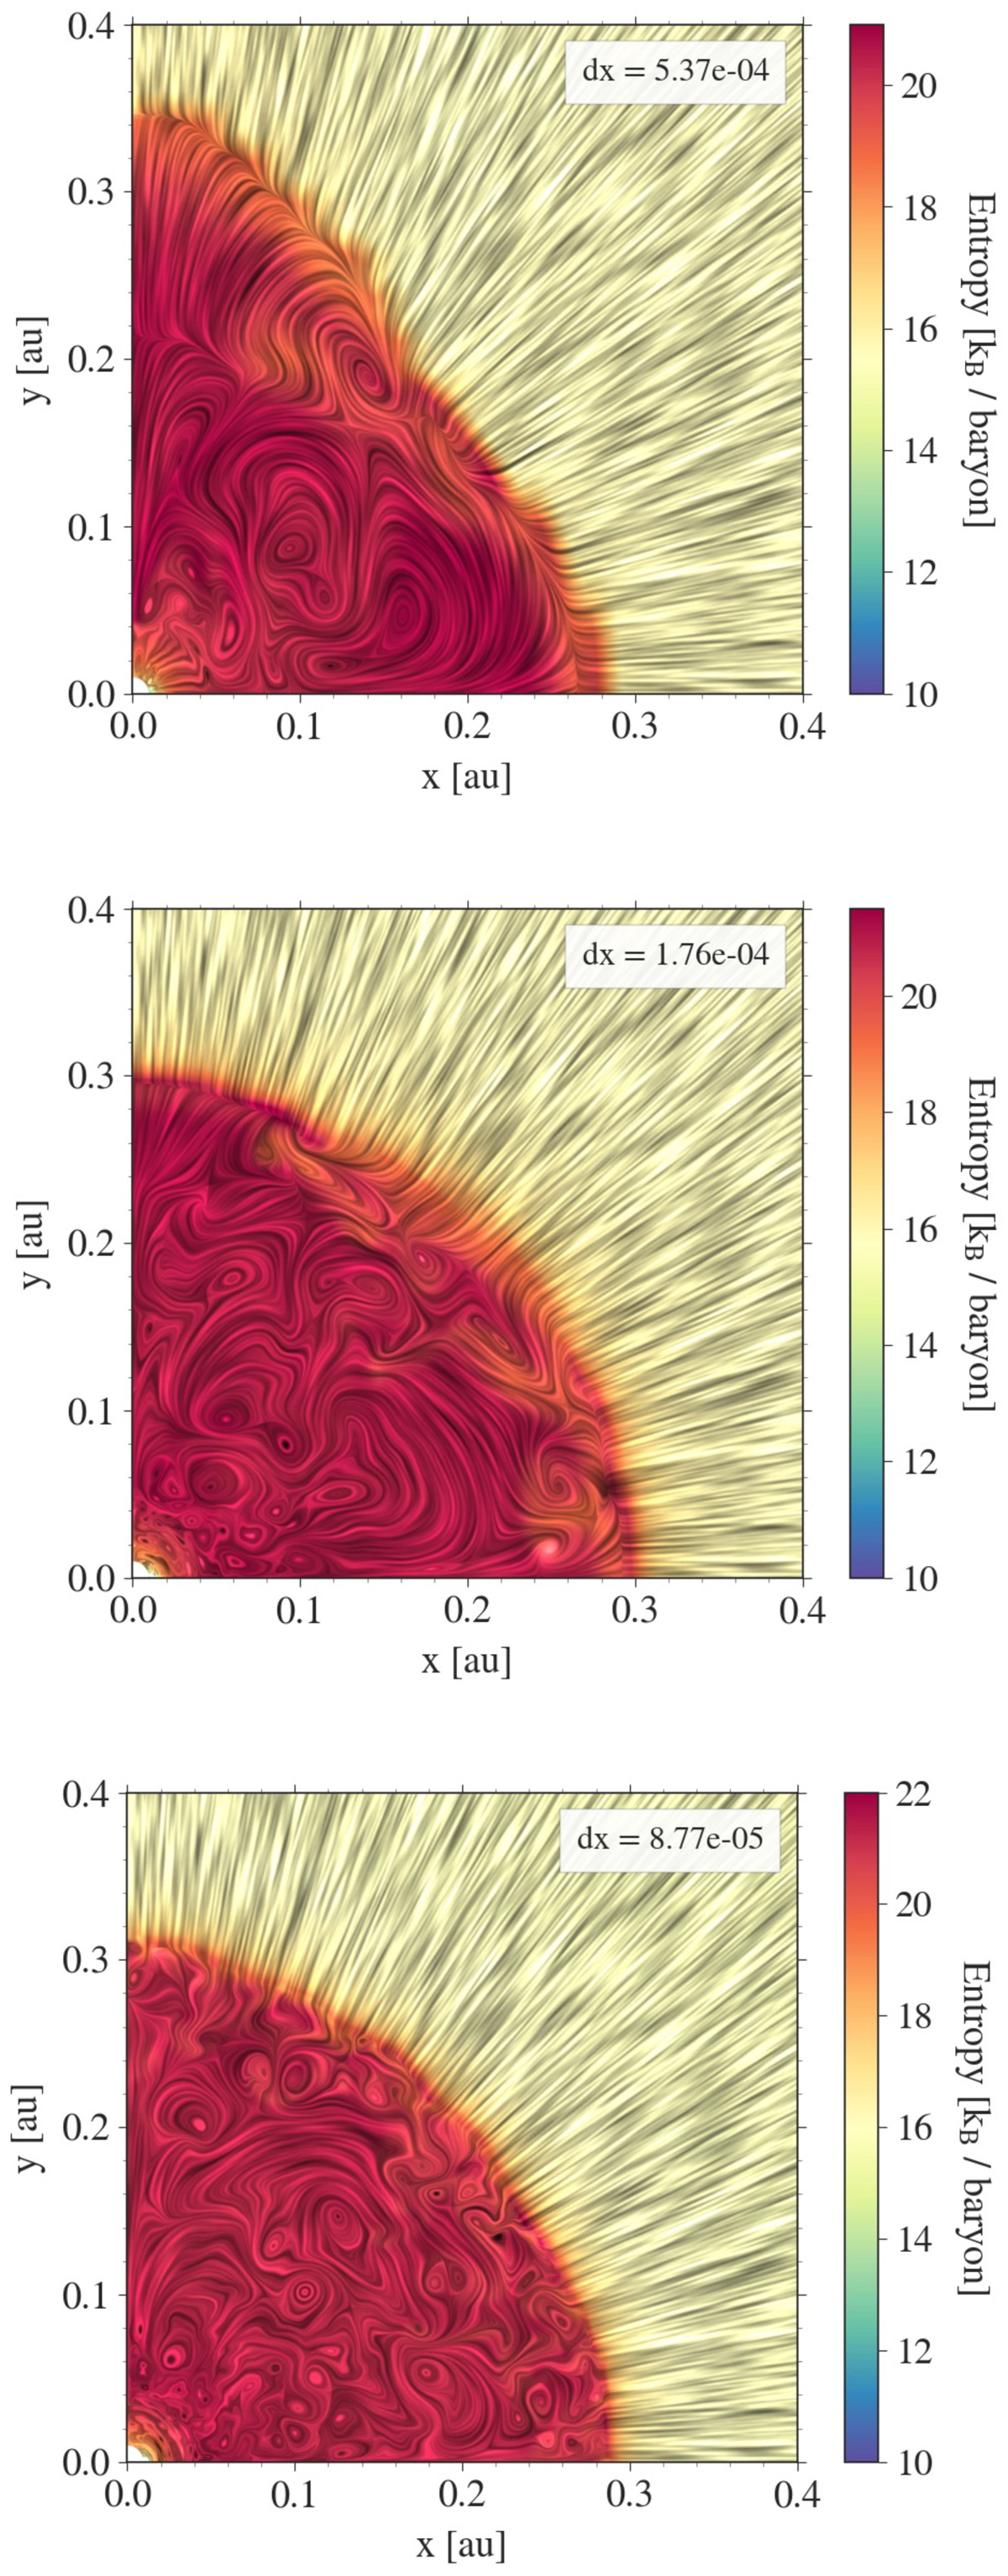
Fig. B.2.
Download original image
Line integral convolution visualisation of the second core formed from the collapse of a 1 M⊙ cloud core at an initial temperature T0 of 10 K and an outer radius of 3000 au. Top to bottom panels: results from runs using different resolutions in an increasing order as indicated in the legends. The entropy behaviour is shown at a snapshot when the central densities are roughly similar. For the results presented in this paper, we use the highest resolution, which allows us to resolve the convective eddies within the second core.
Current usage metrics show cumulative count of Article Views (full-text article views including HTML views, PDF and ePub downloads, according to the available data) and Abstracts Views on Vision4Press platform.
Data correspond to usage on the plateform after 2015. The current usage metrics is available 48-96 hours after online publication and is updated daily on week days.
Initial download of the metrics may take a while.