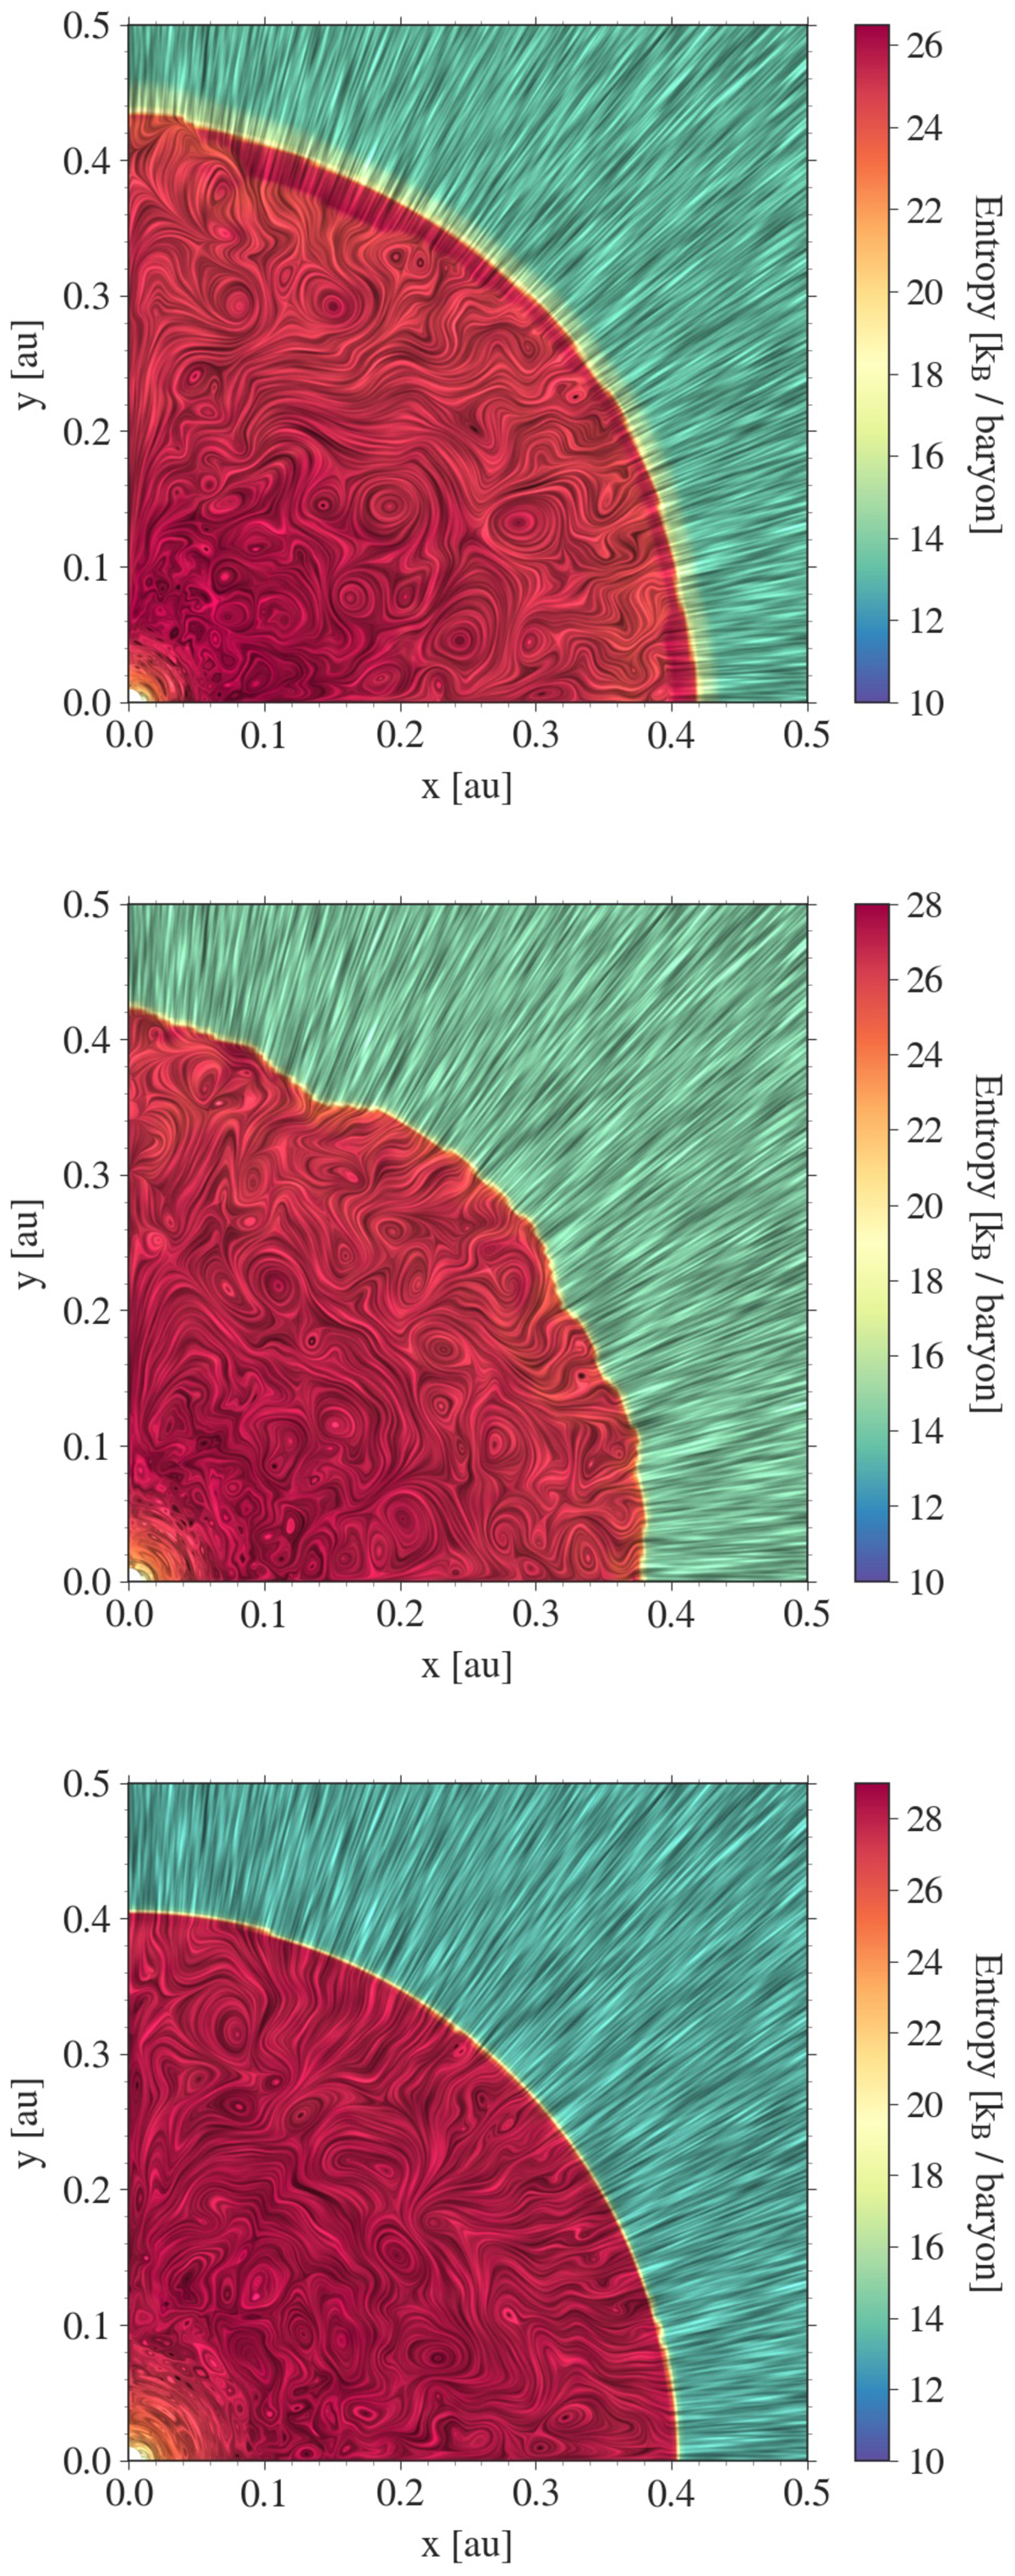
Fig. 11.
Download original image
Line integral convolution visualisation of the entropy behaviour indicating the presence of eddies within the second core. Shown here is the inner 0.5 au of 3000 au collapsing cloud cores with different masses of 5 M⊙ (top), 10 M⊙ (middle), and 20 M⊙ (bottom). The plots are shown at 128 years, 91.4 years, and 86.4 years after the second core formation, for the 5 M⊙, 10 M⊙, and 20 M⊙ cases, respectively.
Current usage metrics show cumulative count of Article Views (full-text article views including HTML views, PDF and ePub downloads, according to the available data) and Abstracts Views on Vision4Press platform.
Data correspond to usage on the plateform after 2015. The current usage metrics is available 48-96 hours after online publication and is updated daily on week days.
Initial download of the metrics may take a while.