Fig. 10.
Download original image
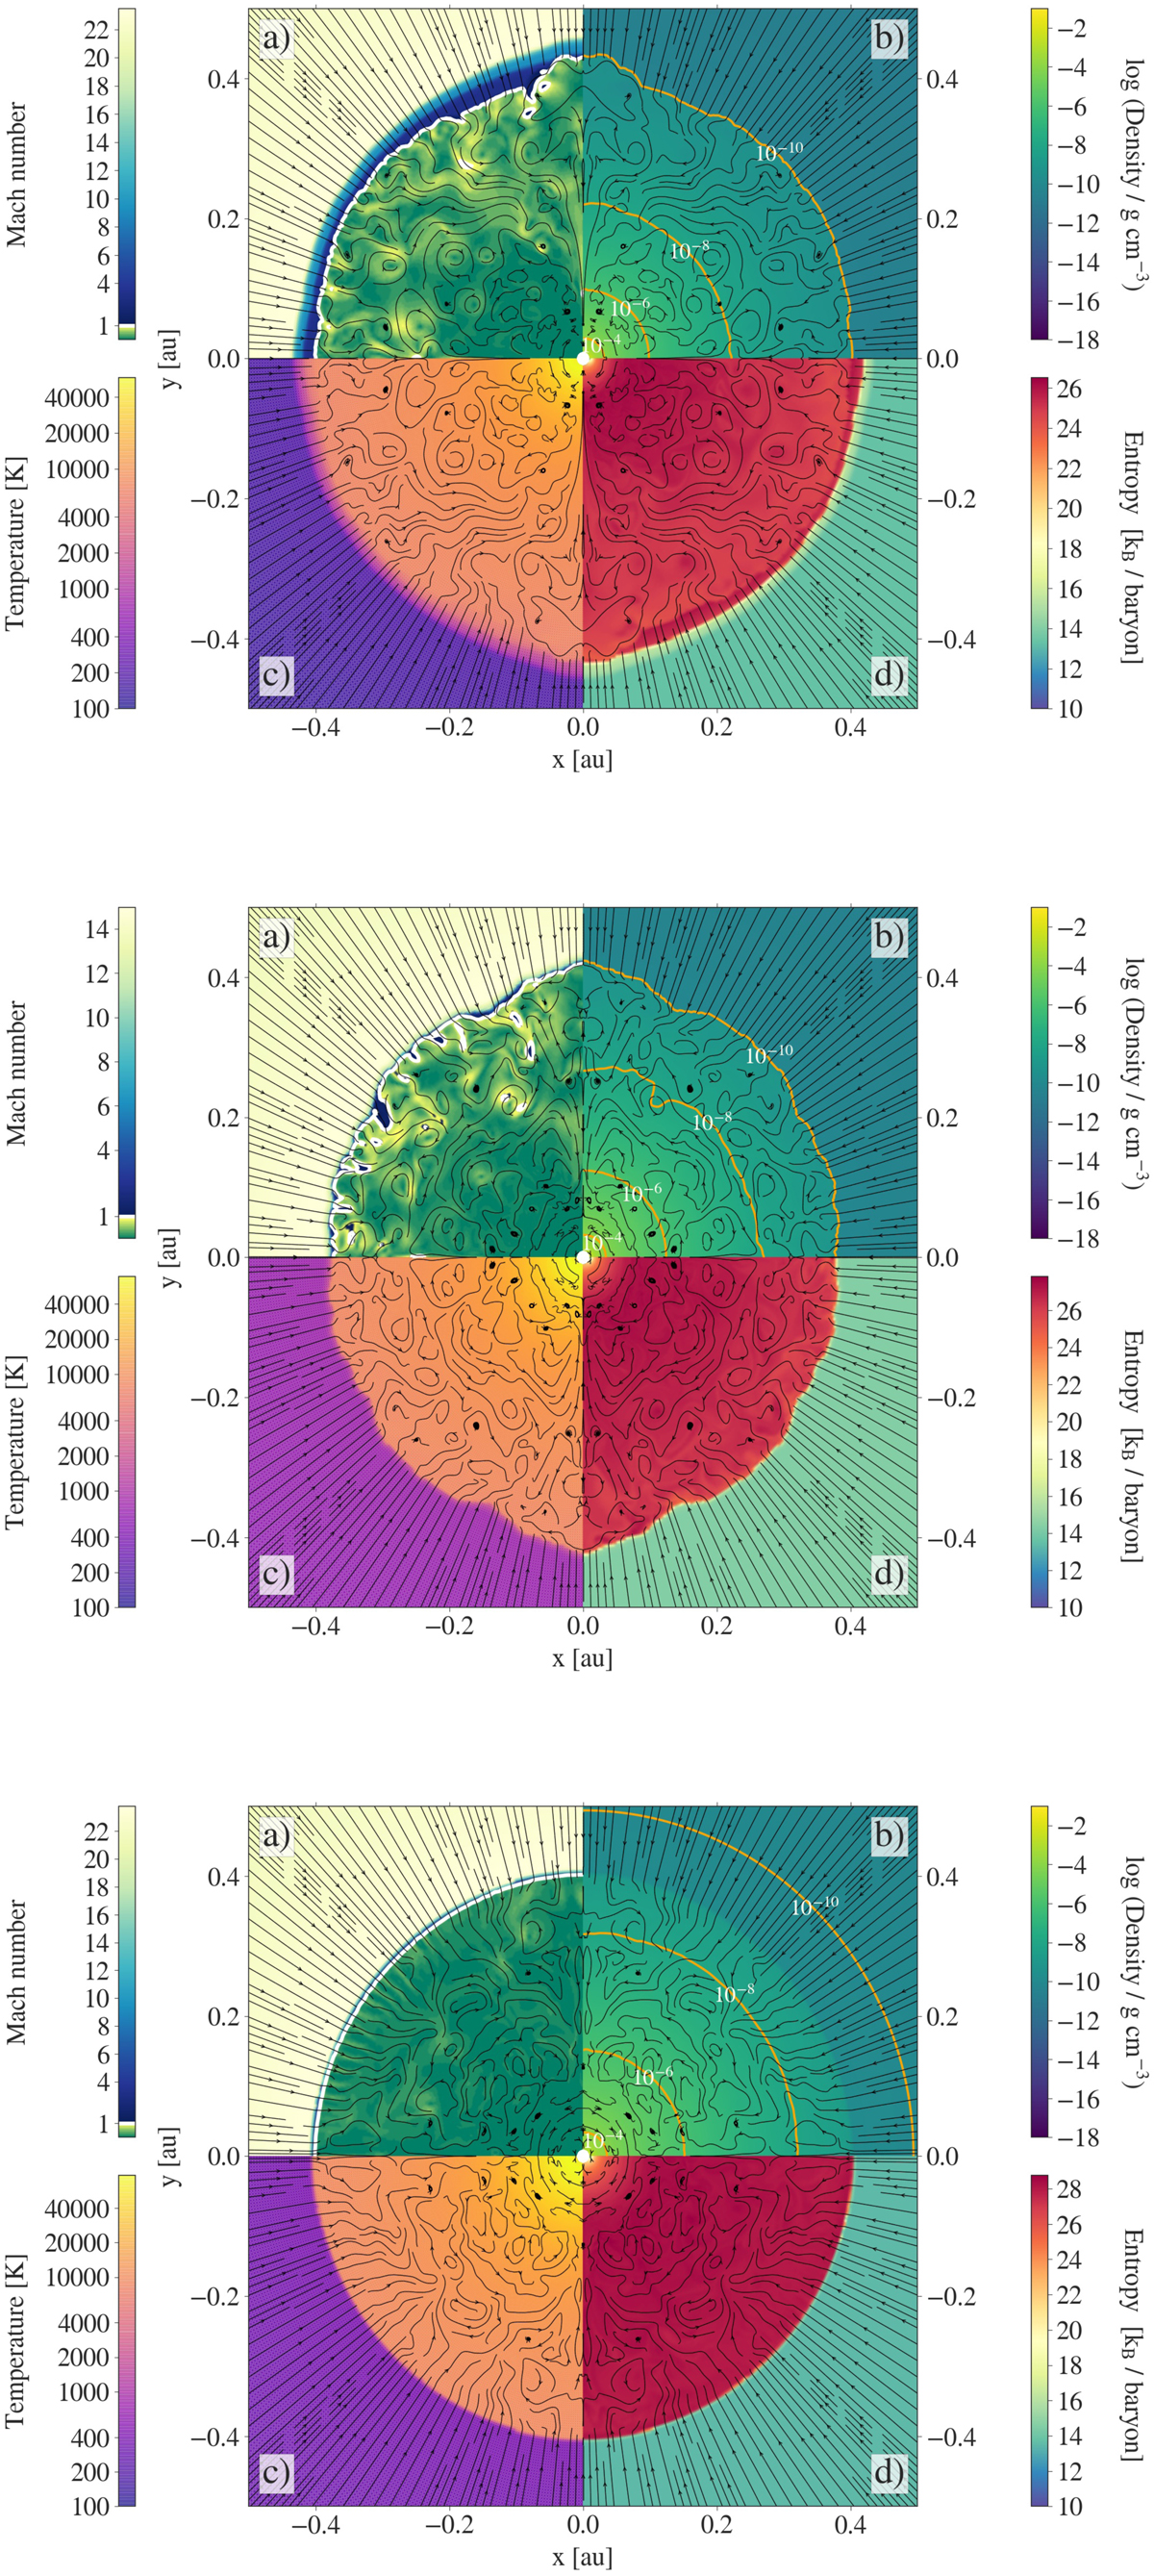
2D view of the second hydrostatic core formed as a result of the collapse of a 5 M⊙ (top), 10 M⊙ (middle), and 20 M⊙ (bottom) cloud core with an initial temperature of 10 K. The four panels in each of the subplots show the (a) Mach number, (b) density, (c) temperature, and (d) entropy within the inner 0.5 au of an initial 3000 au cloud core. The velocity streamlines in black indicate the material falling onto the second core and the mixing inside the core. The white contour in panel a showing Mach = 1.0 separates the sub- and supersonic regions. The different contour lines in panel b show the increase in density towards the centre. The plots are shown at 128 years, 91.4 years, and 86.4 years after the second core formation, for the 5 M⊙, 10 M⊙, and 20 M⊙ cases, respectively.
Current usage metrics show cumulative count of Article Views (full-text article views including HTML views, PDF and ePub downloads, according to the available data) and Abstracts Views on Vision4Press platform.
Data correspond to usage on the plateform after 2015. The current usage metrics is available 48-96 hours after online publication and is updated daily on week days.
Initial download of the metrics may take a while.