Fig. 5.
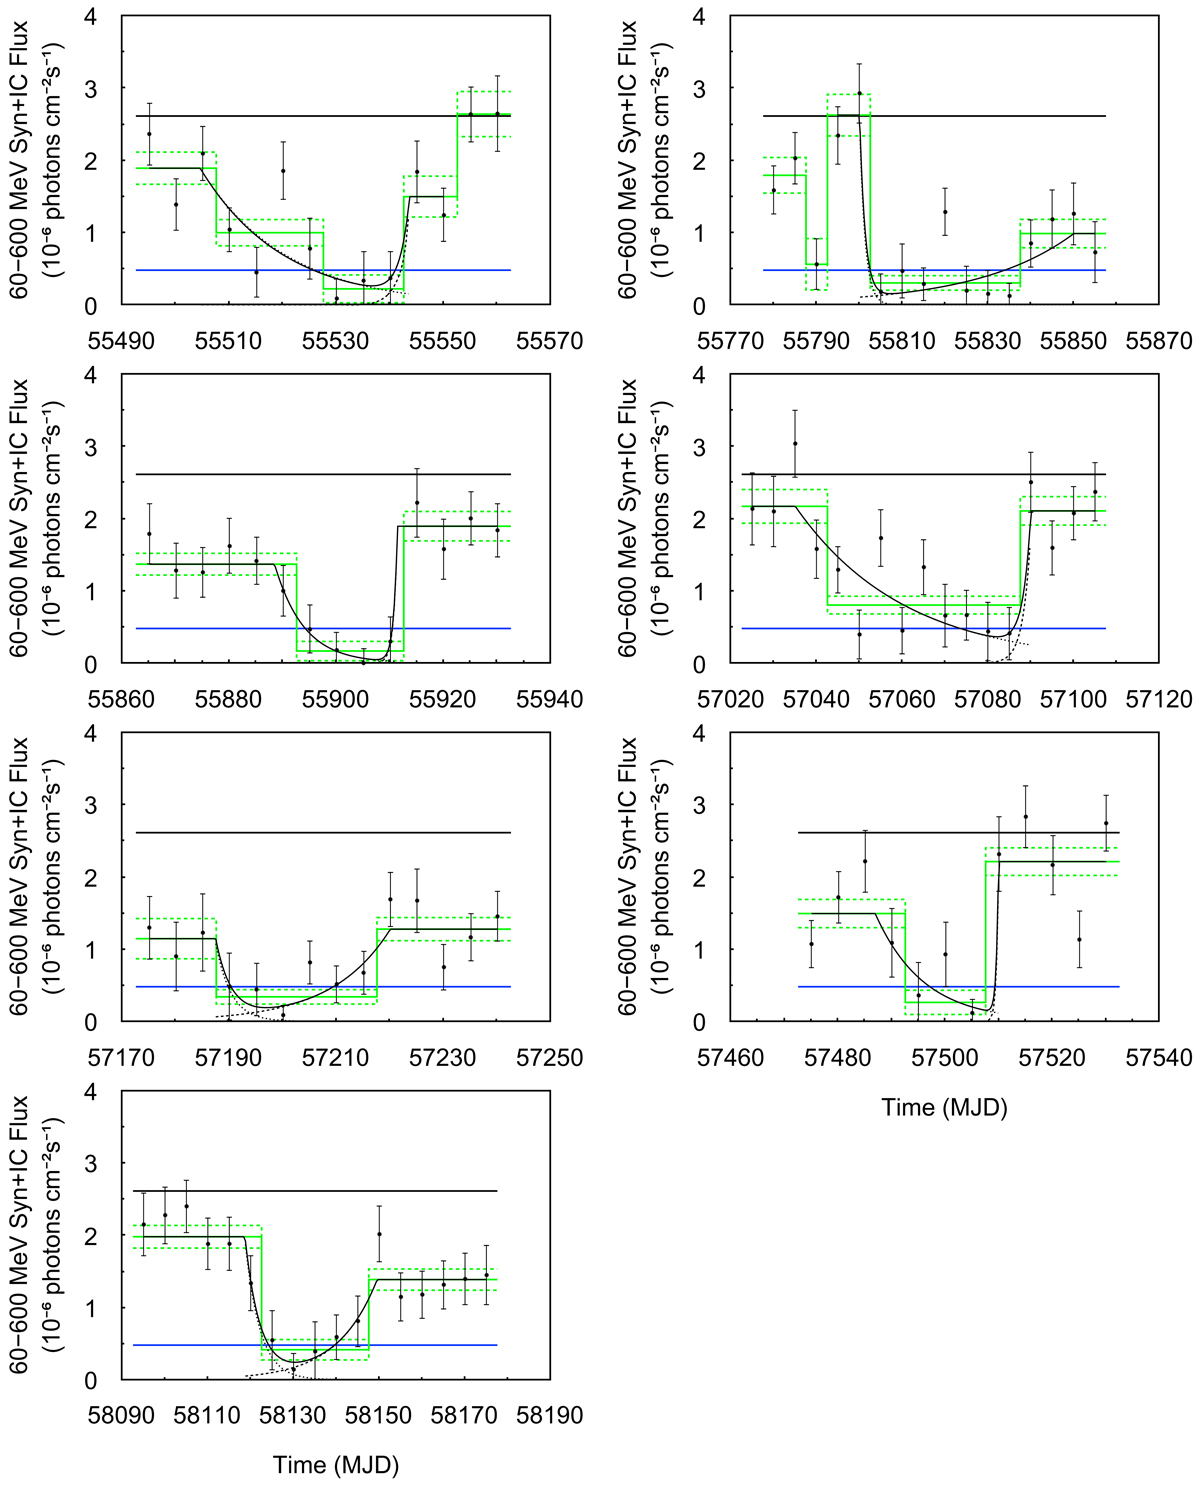
Seven analysis windows covering continuous episodes of low-flux which are tabulated in Table 3. The uniform distribution fit to the bins of each Bayesian block (solid line) and its 1σ uncertainty (dashed line) are indicated in green. The function fit to each segment of the light curve, as well as its two exponential terms, is plotted as black curves (see the text for detail). The black and blue horizontal lines respectively indicate the intermediate-state average flux and the threshold of the “low” state we define.
Current usage metrics show cumulative count of Article Views (full-text article views including HTML views, PDF and ePub downloads, according to the available data) and Abstracts Views on Vision4Press platform.
Data correspond to usage on the plateform after 2015. The current usage metrics is available 48-96 hours after online publication and is updated daily on week days.
Initial download of the metrics may take a while.