Fig. 25.
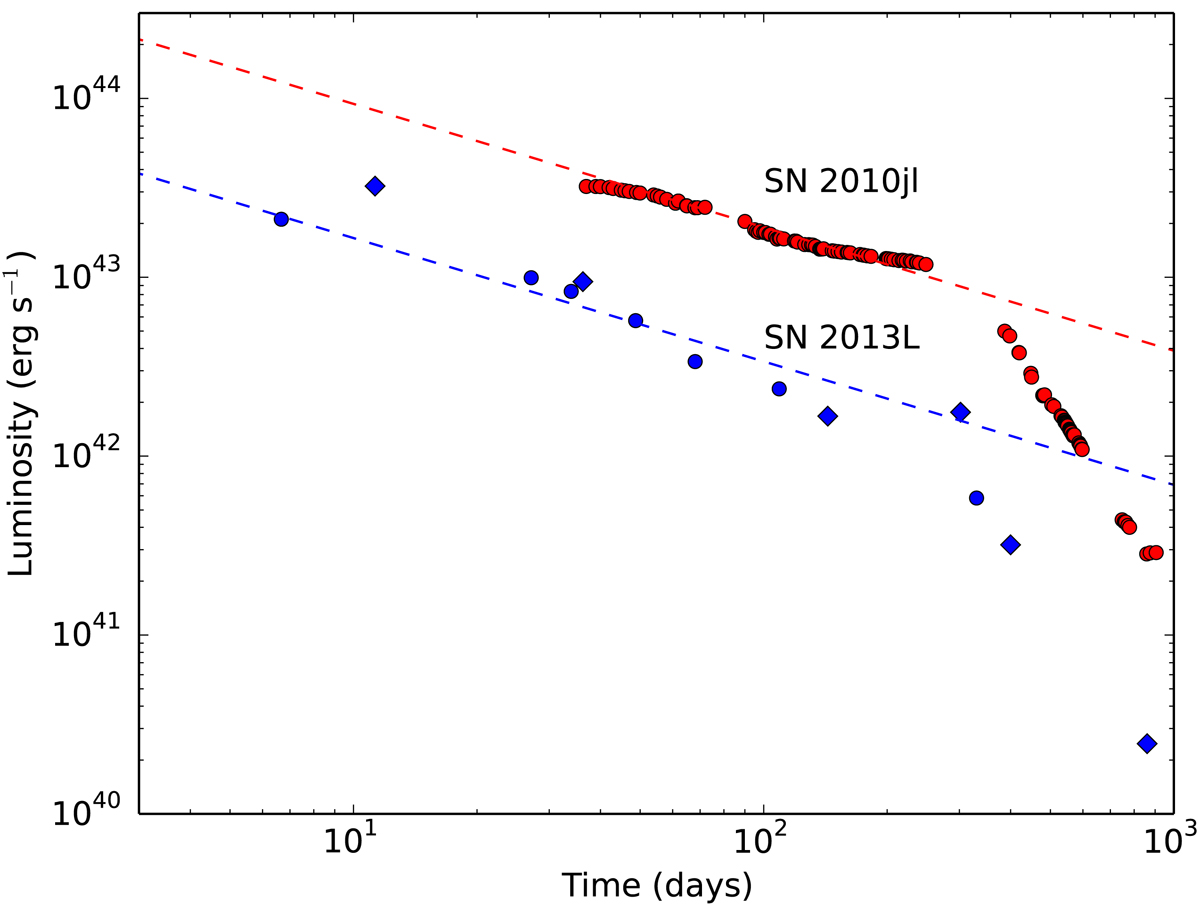
Bolometric luminosity as a function of time for SN 2013L together with SN 2010jl. The dashed lines represent the luminosity predicted for a model with the velocity dependence from Eq. (9) and mass-loss rates Ṁ = 1.7 × 10⁻² M⊙ yr−1 and Ṁ = 9 × 10⁻² M⊙ yr−1, respectively. For SN 2013L the blue dots refer to luminosities derived from optical spectral fits, while the diamonds refer to NIR fits.
Current usage metrics show cumulative count of Article Views (full-text article views including HTML views, PDF and ePub downloads, according to the available data) and Abstracts Views on Vision4Press platform.
Data correspond to usage on the plateform after 2015. The current usage metrics is available 48-96 hours after online publication and is updated daily on week days.
Initial download of the metrics may take a while.