Fig. 5.
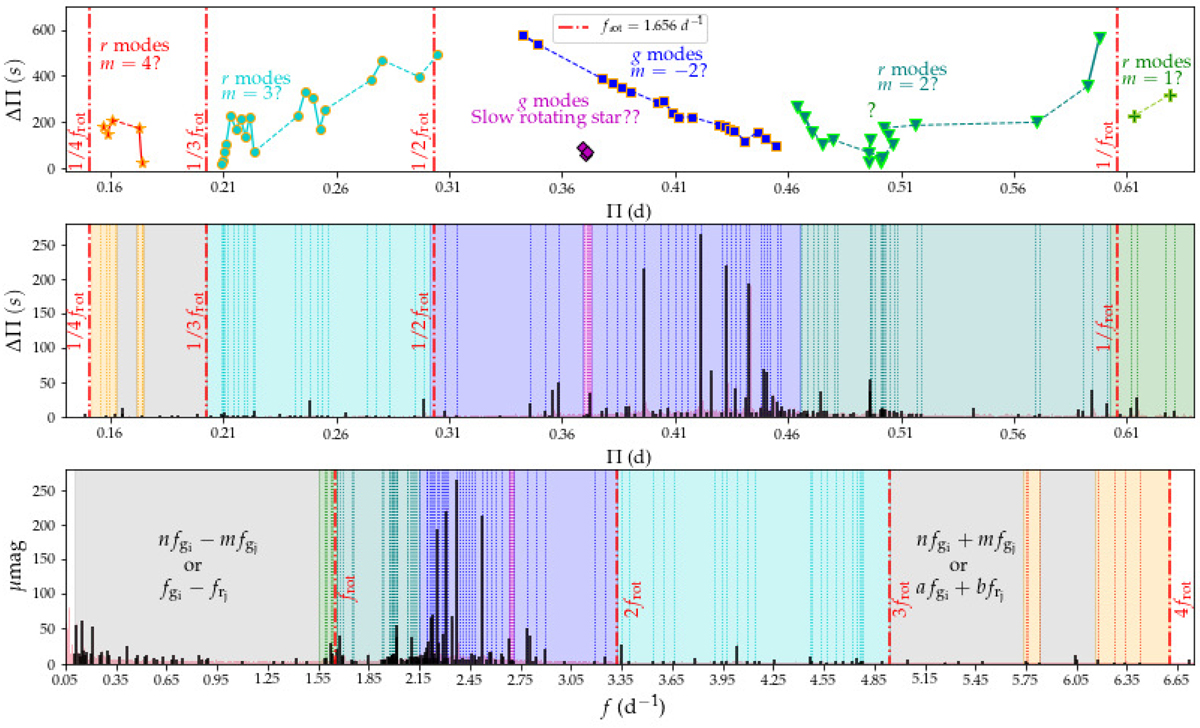
Panel a: period spacing patterns for r and g modes on the period spectrum of KIC 8975515 (LC). Panel b: associated frequencies for the detected g and r modes in panel a (Tables 3 and A.1) are shown with pointed-lines in the same color in panel a. The frequencies in black are the significant modes and the full periodogram of KIC 8975515 is plotted in light pink.
Current usage metrics show cumulative count of Article Views (full-text article views including HTML views, PDF and ePub downloads, according to the available data) and Abstracts Views on Vision4Press platform.
Data correspond to usage on the plateform after 2015. The current usage metrics is available 48-96 hours after online publication and is updated daily on week days.
Initial download of the metrics may take a while.