Fig. 4.
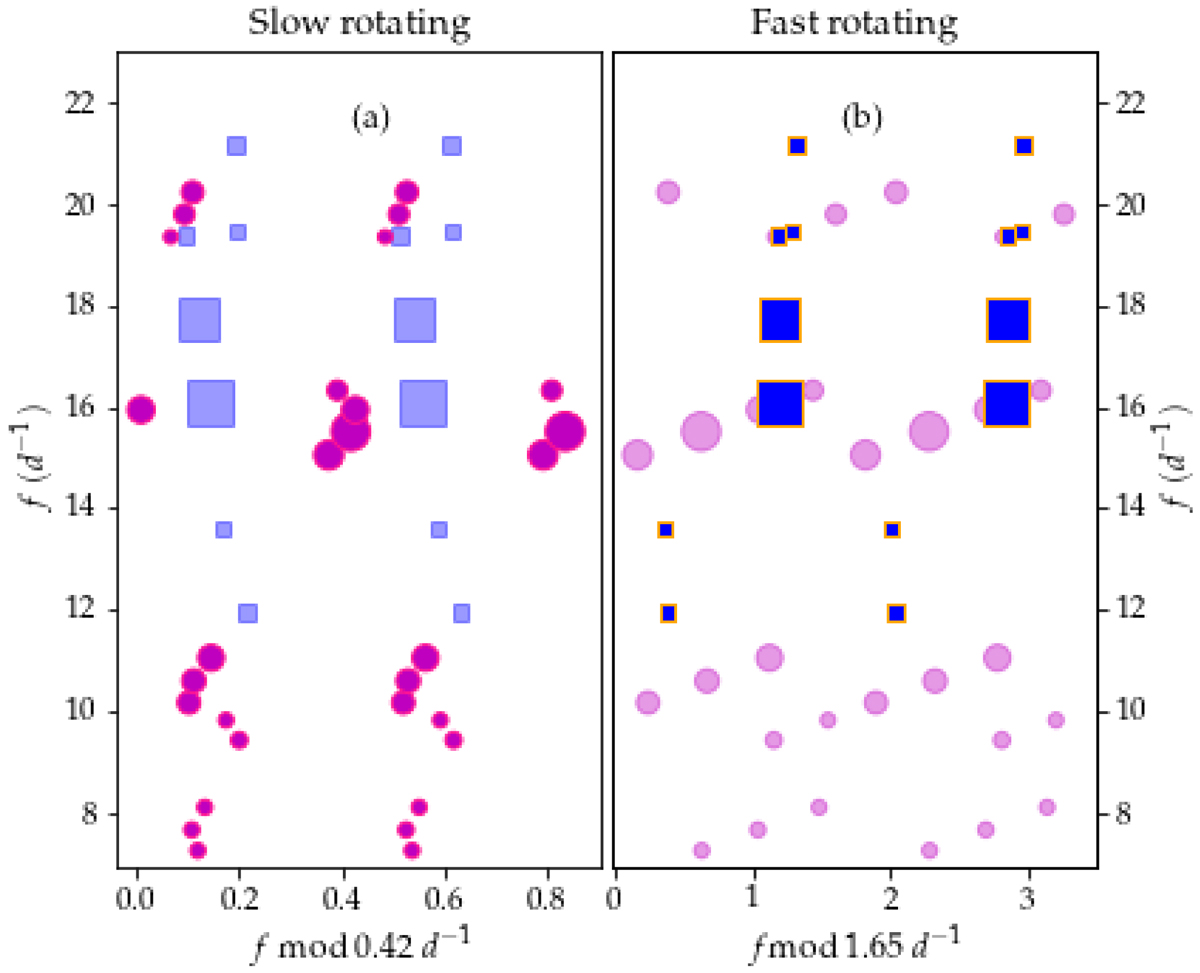
Échelle diagram of p modes with (quasi-)regular frequency spacing from the Fourier spectrum of KIC 8975515 (Table 2). Symbol size refers to the amplitude of the p modes. Color coding and symbols are similar to Fig. 3. The symbol size is associated with the mode amplitudes. Panel a: frequency modulo of the mean rotational frequency spacing value associated with the slowly-rotating star, 0.419 d−1 (magenta circles), was plotted twice. Panel b: frequency modulo of the mean rotational frequency spacing value associated with the fast-rotating star, 1.654 d−1 (blue squares), was plotted twice.
Current usage metrics show cumulative count of Article Views (full-text article views including HTML views, PDF and ePub downloads, according to the available data) and Abstracts Views on Vision4Press platform.
Data correspond to usage on the plateform after 2015. The current usage metrics is available 48-96 hours after online publication and is updated daily on week days.
Initial download of the metrics may take a while.