Fig. 2.
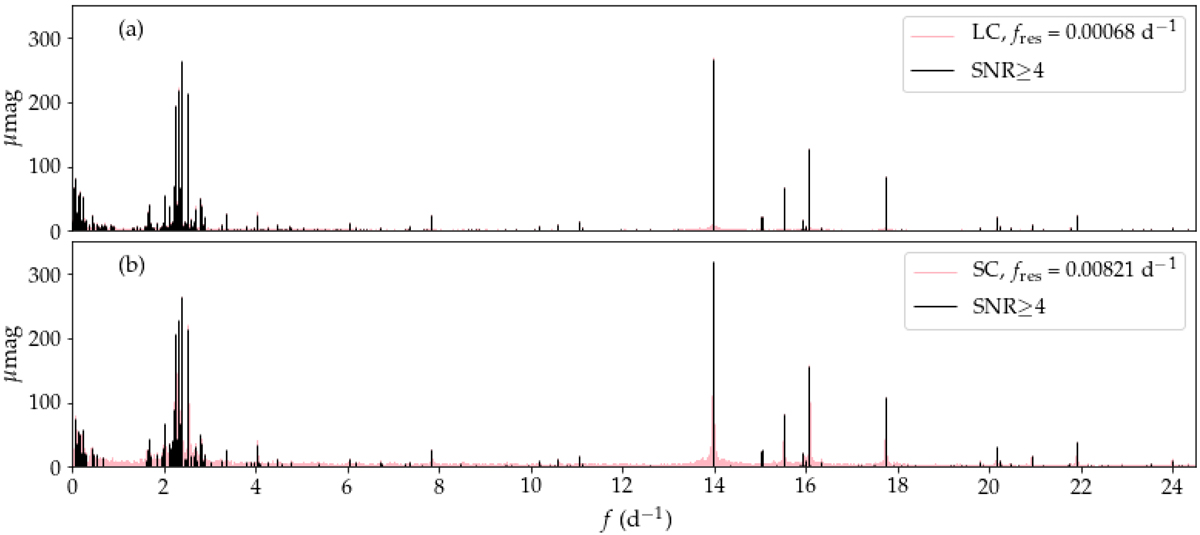
Fourier spectrum of KIC 8975515 (pink). Panel a: frequency spectrum associated with LC observations (pink) and the significant frequencies with S/N ≥ 4.0 in a box size of 2 d−1 (black). Panel b: same as (a) but for the SC observations (referring to the quarters Q2.3 as well as Q5.1, 5.2, and 5.3). There is no significant frequency between 25 and 50 d−1 and we clipped it off from the illustration.
Current usage metrics show cumulative count of Article Views (full-text article views including HTML views, PDF and ePub downloads, according to the available data) and Abstracts Views on Vision4Press platform.
Data correspond to usage on the plateform after 2015. The current usage metrics is available 48-96 hours after online publication and is updated daily on week days.
Initial download of the metrics may take a while.