Fig. 1.
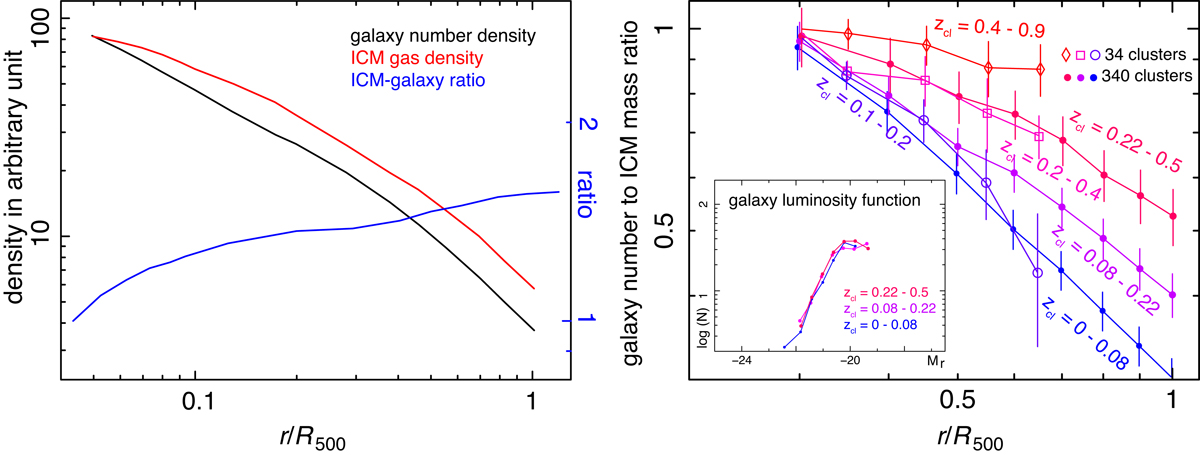
Left panel: projected radial density profiles (left ordinate) of the galaxy surface number (black) and the ICM (red) in nearby (z ≤ 0.08) clusters, normalized at a radius of 0.05 R500. Both data are taken from the sample of Gu et al. (2016). The ICM to galaxy density ratio is plotted in blue (right ordinate). Right panel: observed GNIMR profiles averaged over clusters in different redshift bins. This plot shows a combination of two samples, 34 clusters (z = 0.1−0.9) from Gu et al. (2013a, open symbols), and 340 clusters (z = 0−0.5) from Gu et al. (2016, filled symbols). Error bars are at the 1σ level. The r-band luminosity functions of the identified member galaxies from the 340 cluster sample in different redshift bins are shown in the inset.
Current usage metrics show cumulative count of Article Views (full-text article views including HTML views, PDF and ePub downloads, according to the available data) and Abstracts Views on Vision4Press platform.
Data correspond to usage on the plateform after 2015. The current usage metrics is available 48-96 hours after online publication and is updated daily on week days.
Initial download of the metrics may take a while.