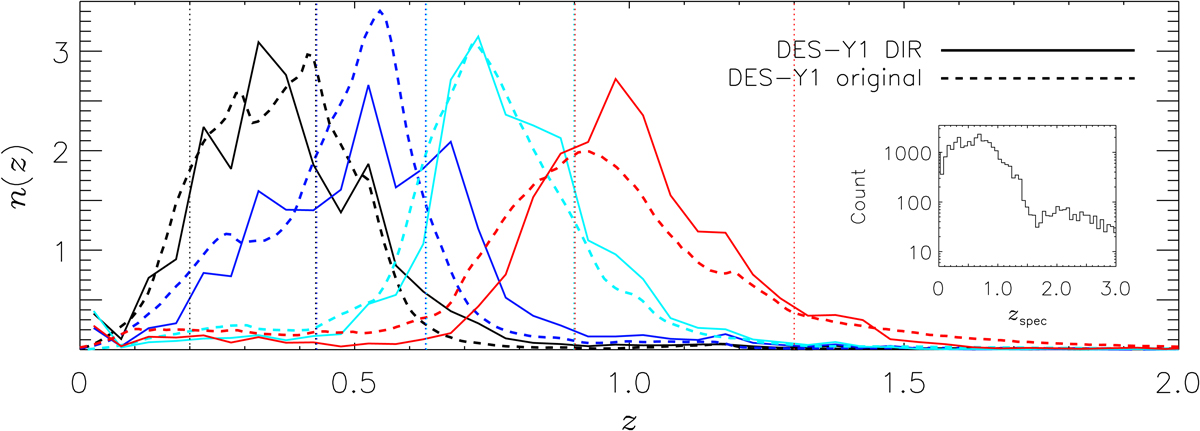
Fig. 2.

DES-Y1 redshift distributions for the four tomographic bins (in black, blue, cyan, and red, respectively), showing the publicly released distributions (dashed) and the spectroscopically determined distributions using the DIR approach (solid). The distributions based on spectroscopy are systematically shifted to higher redshifts than the original distributions (accounting for Δzi), and hence favor a lower value of S8 than the original DES-Y1 analysis in T18. See Table 1 for the mean redshifts of the different tomographic bins for the two approaches. The vertical dotted lines denote the tomographic bin boundaries. The small inset shows the redshift distribution of the matched photometry/spectroscopy catalog for DES-Y1 containing approximately 30 000 objects used in the DIR method. The spectroscopic calibration samples are obtained from zCOSMOS, VVDS-Deep (2h), CDFS, DEEP2 (2h), and VVDS-Wide (22h). We do not show the uncertainties in the n(z) for visual clarity (instead see Table 1 for uncertainties in the mean redshifts).
Current usage metrics show cumulative count of Article Views (full-text article views including HTML views, PDF and ePub downloads, according to the available data) and Abstracts Views on Vision4Press platform.
Data correspond to usage on the plateform after 2015. The current usage metrics is available 48-96 hours after online publication and is updated daily on week days.
Initial download of the metrics may take a while.


