Fig. 9
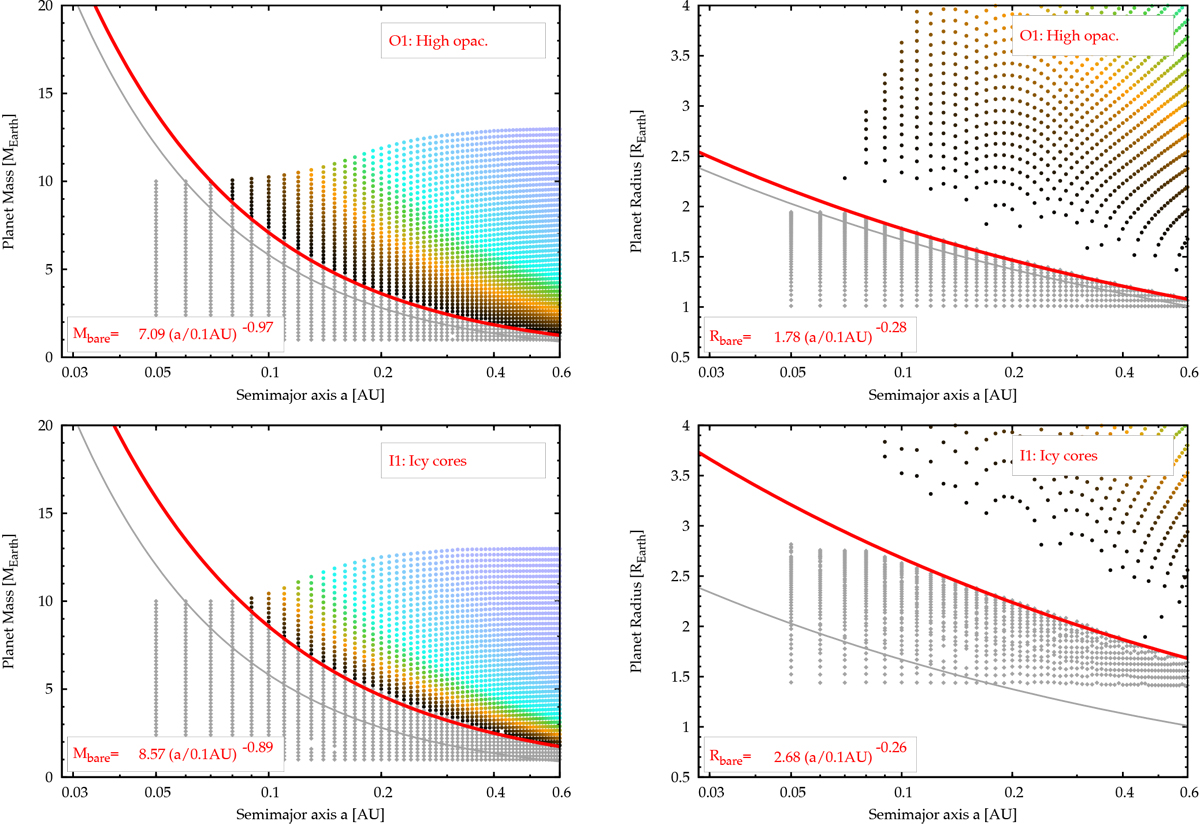
Same as Fig. 4 but it shows the impact of the atmospheric opacity (O1, top panels) and of the composition of the solid core (I1, bottom panels). These simulations cover a smaller range in initial core masses than the other ones. In simulation O1 the atmospheric opacity is uniformly increased by a factor 10. In simulation I1 an ice mass fraction in the core of unity instead of an Earth-like composition was assumed. The thin gray line shows the transition mass and radius in the nominal simulation M0 to allow direct comparison.
Current usage metrics show cumulative count of Article Views (full-text article views including HTML views, PDF and ePub downloads, according to the available data) and Abstracts Views on Vision4Press platform.
Data correspond to usage on the plateform after 2015. The current usage metrics is available 48-96 hours after online publication and is updated daily on week days.
Initial download of the metrics may take a while.