Fig. 8
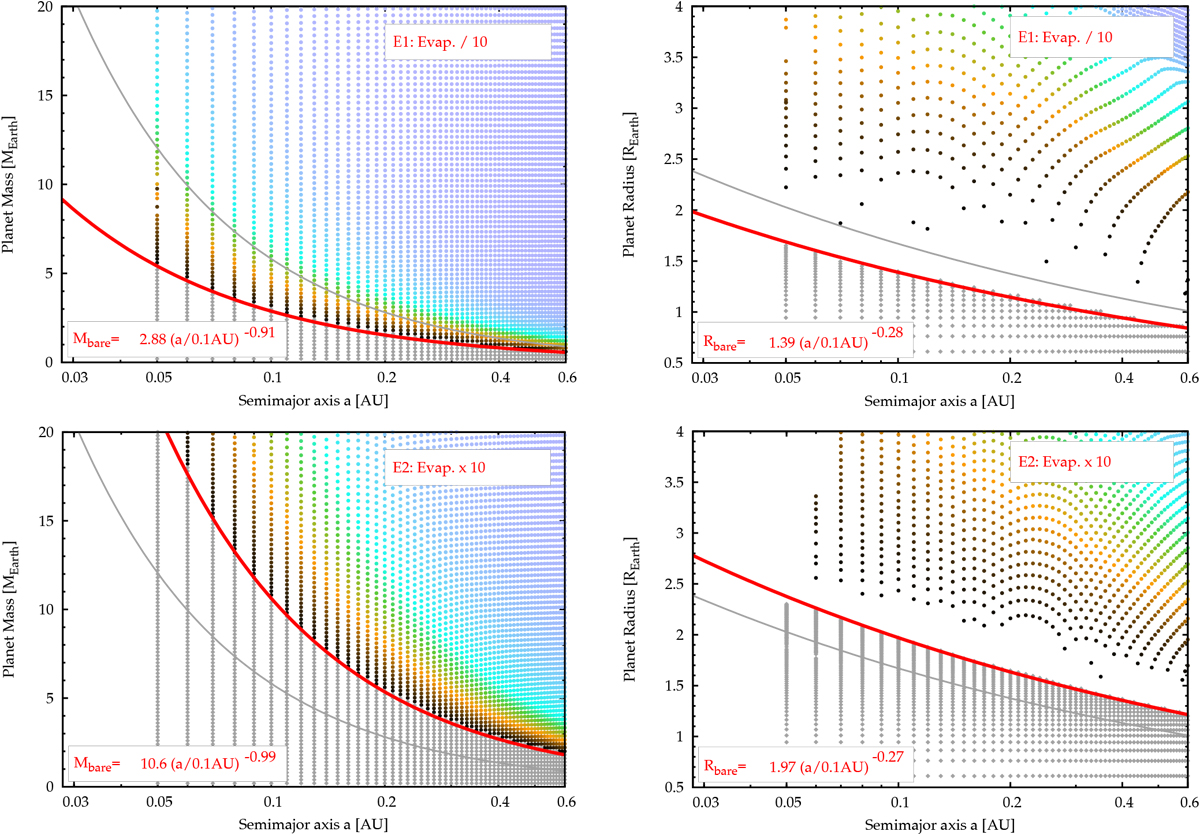
Impact of the strength of evaporation on the transition. The figure is analogous to Fig. 4 but for simulation E1 (top panels) and E2 (bottom panels) where the evaporation rate is uniformly reduced (E1) respectively increased (E2) by a factor 10 relative to the nominal case. The transition mass and radius were again fit with a power law for Mbare and Rbare as shown with the thick red line. The power law exponents for the dependency on the distance have remained similar as in the reference case M3, but the absolute value of Mbare is reduced in E1 (weak evaporation) relative to M3 by a factor 2.02, and a factor 1.20 for Rbare. In E2 (strong evaporation), Mbare and Rbare have increased by a factor 1.82 and 1.18, respectively. The thinner gray line shows the transition mass and radius in the nominal simulation M0 to allow direct comparison. M3 is in turn very similar to M0.
Current usage metrics show cumulative count of Article Views (full-text article views including HTML views, PDF and ePub downloads, according to the available data) and Abstracts Views on Vision4Press platform.
Data correspond to usage on the plateform after 2015. The current usage metrics is available 48-96 hours after online publication and is updated daily on week days.
Initial download of the metrics may take a while.