Fig. 6
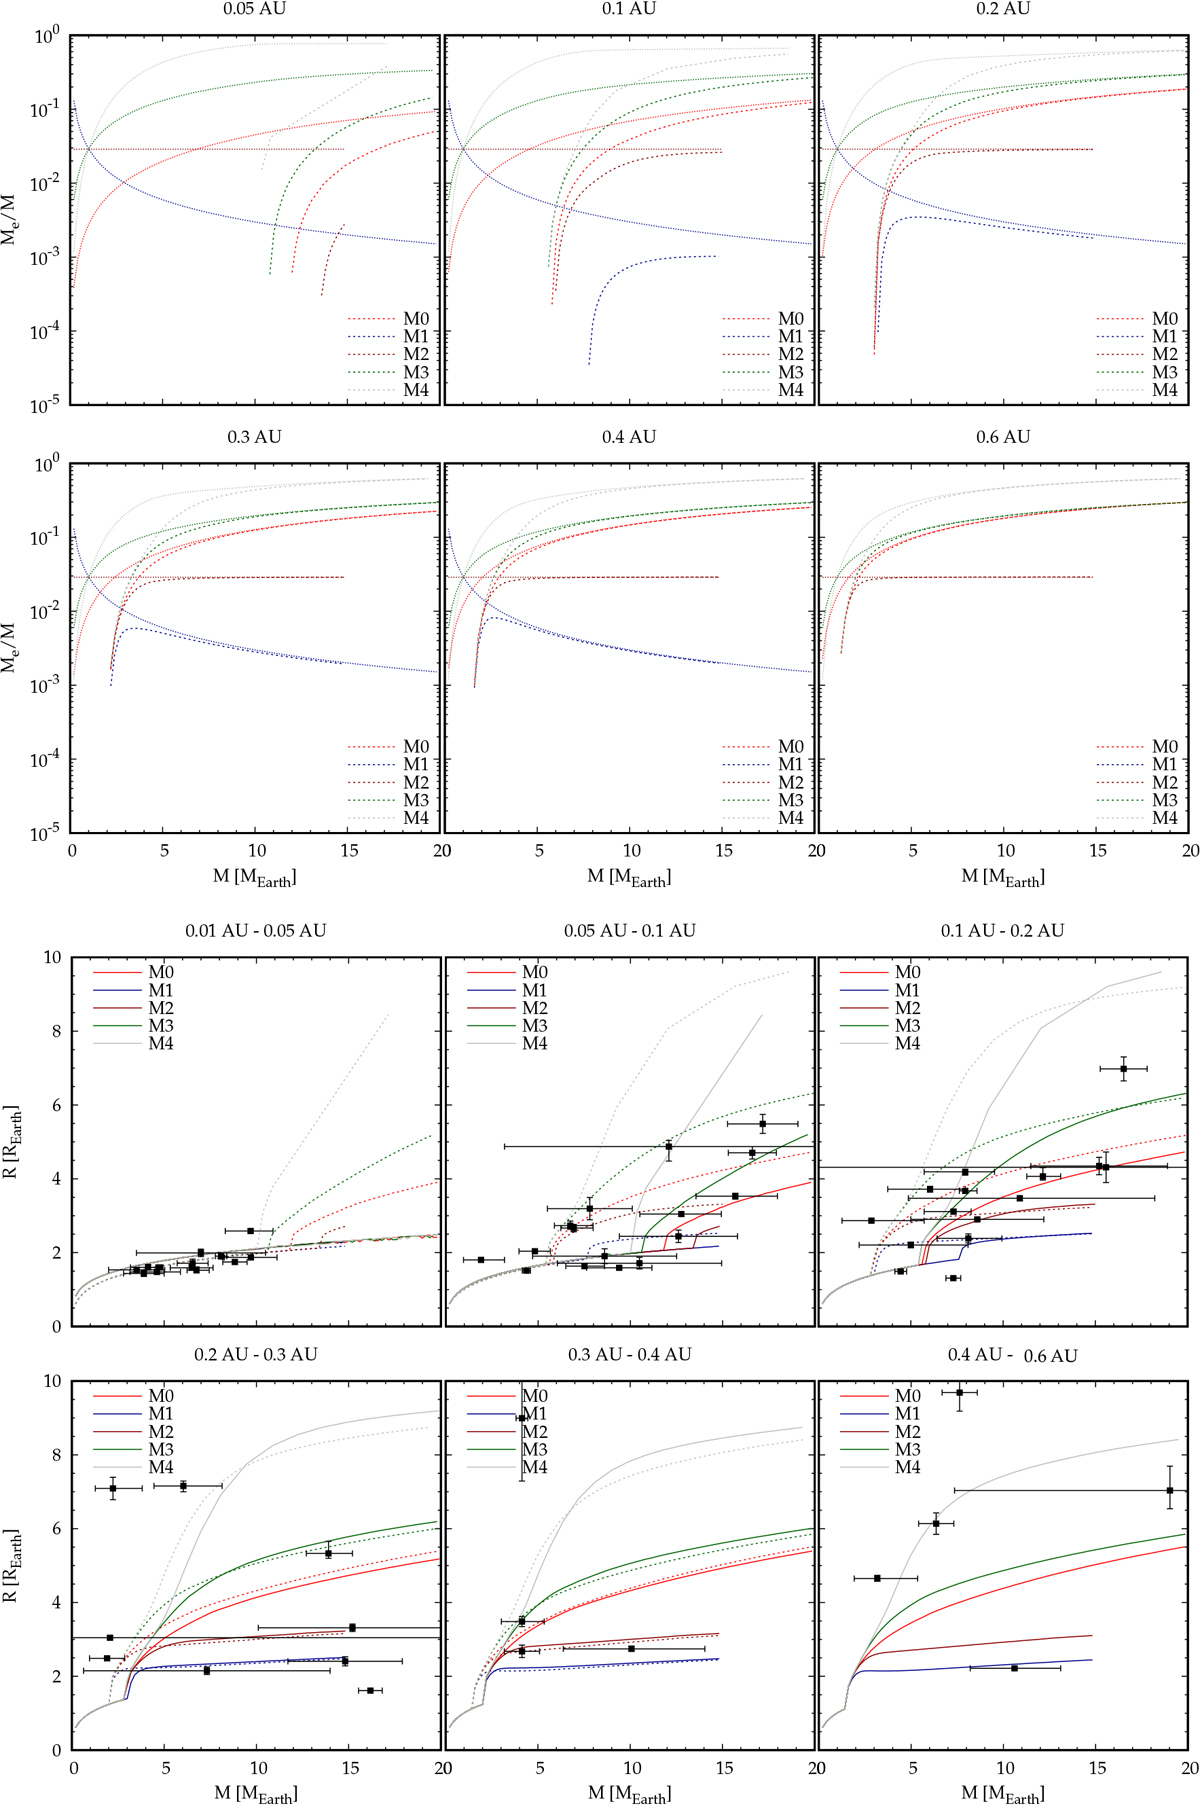
Upper six panels: envelope mass fraction Me∕M as a functionof planet mass M for 6 different orbital distances. The dashed lines show the envelope mass fraction at 5 Gyr,while the dotted lines show the initial (postformation) envelope mass fraction Me,0 ∕M. The simulations M0–M4 from Figs. 4 and 5 are shown to display the consequences of different initial conditions. Lower six panels: corresponding mass-radius relations compared to observations. In each panel, the solid and dashed lines correspond to the lower and upper limit of the distance interval, respectively. Black dots with error bars show the observed extrasolar planets orbiting stars with masses between 0.7 and 1.3 M⊙ in these distance intervals.
Current usage metrics show cumulative count of Article Views (full-text article views including HTML views, PDF and ePub downloads, according to the available data) and Abstracts Views on Vision4Press platform.
Data correspond to usage on the plateform after 2015. The current usage metrics is available 48-96 hours after online publication and is updated daily on week days.
Initial download of the metrics may take a while.