Fig. 3
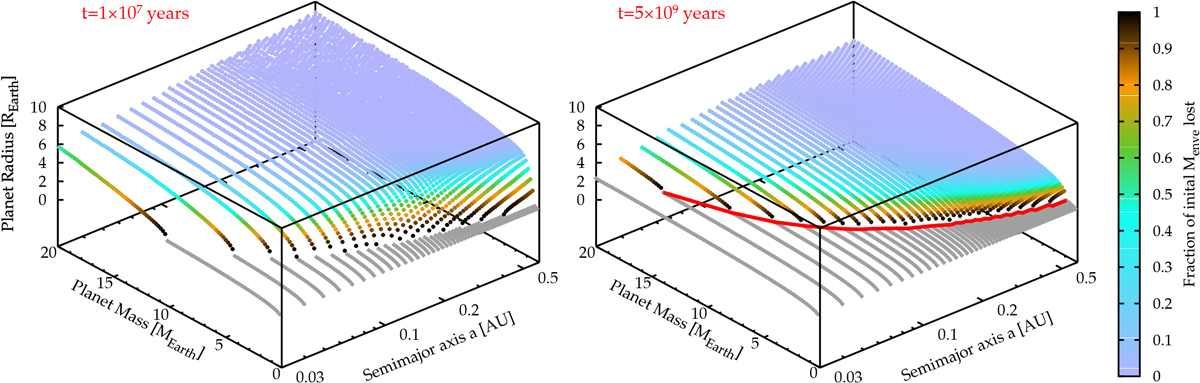
Evolution of the planets of the nominal model M0 in the distance-mass-radius-time space. The radius (z-axis) at 10 Myr and5 Gyr is shown as a function of semimajor axis and mass. The color code gives the fraction of the initial H/He envelope that was evaporated. Planets that have lost all H/He are plotted in gray. The overall contraction and the growing bare core triangle is visible, extending to larger masses and distances as time goes on. The red curve indicates Mbare and Rbare at 5 Gyr as in Fig. 4.
Current usage metrics show cumulative count of Article Views (full-text article views including HTML views, PDF and ePub downloads, according to the available data) and Abstracts Views on Vision4Press platform.
Data correspond to usage on the plateform after 2015. The current usage metrics is available 48-96 hours after online publication and is updated daily on week days.
Initial download of the metrics may take a while.