Fig. 14
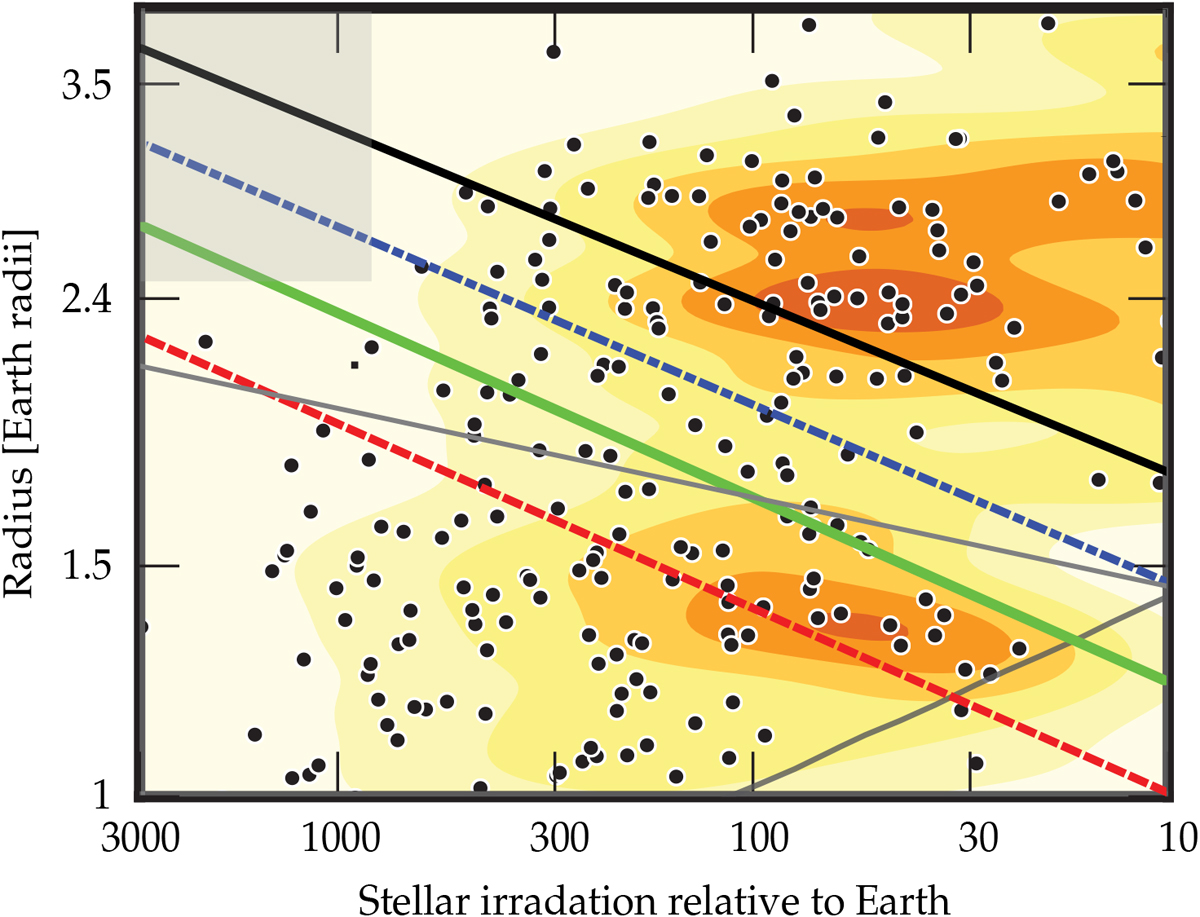
Comparison of the locus of the valley as observed for Kepler planets around solar-like stars (points and yellow-brown occurrence maps, Fulton & Petigura 2018, with permission) and as theoretically found in the simulations in Table 1 (lines). It is important to note that all the theoretical lines show the bottom of the valley, not its middle. The green solid line is the nominal simulation M0. The red dashed and blue dashed-dotted lines are E1 and E2 (strong and weak evaporation). The black line is I1 (ice cores). The thin gray line assumes a distance-dependent evaporation efficiency factor. The gray rectangle in the top left corner is the empty evaporation desert as found in the nominal simulation M0. The black triangle is observationally unconstrained.
Current usage metrics show cumulative count of Article Views (full-text article views including HTML views, PDF and ePub downloads, according to the available data) and Abstracts Views on Vision4Press platform.
Data correspond to usage on the plateform after 2015. The current usage metrics is available 48-96 hours after online publication and is updated daily on week days.
Initial download of the metrics may take a while.