Fig. 1
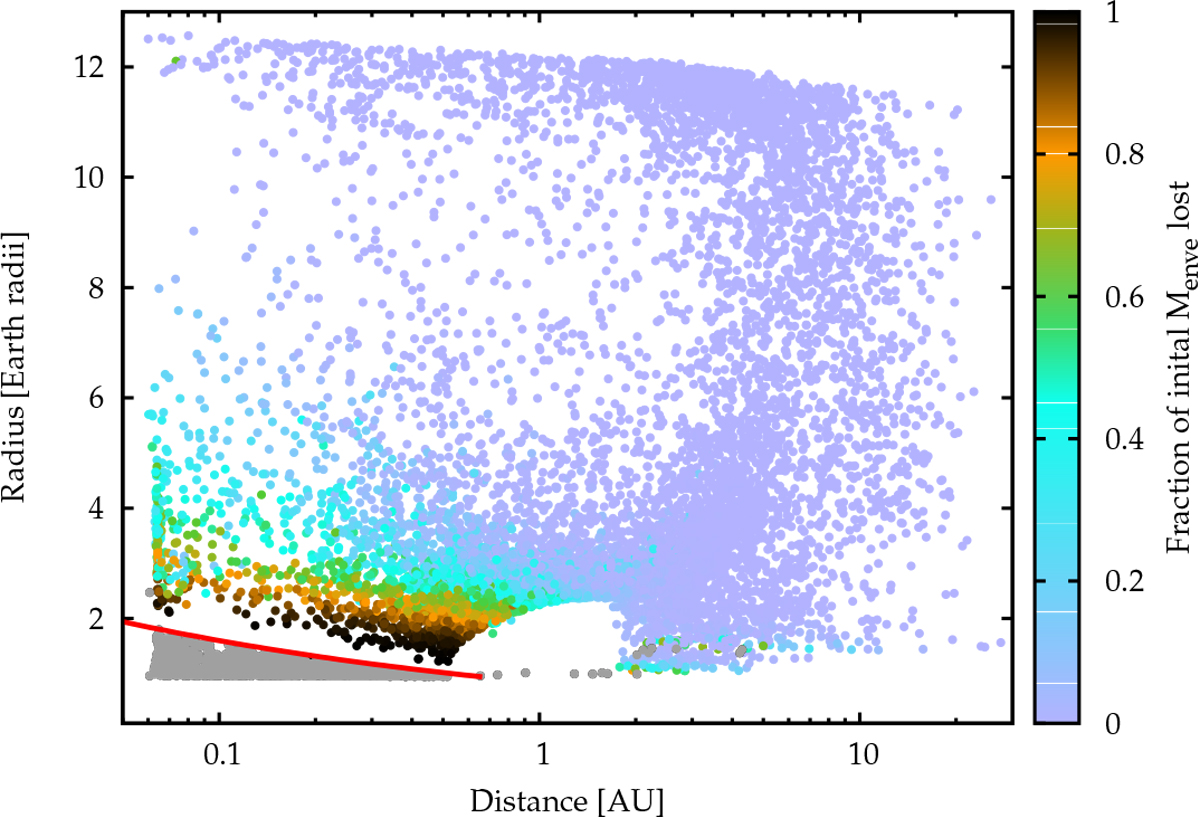
Distance-radius diagram from an early population synthesis calculation around 1 M⊙ stars at 5Gyr. Colors give the fraction of the initial H/He envelope mass that was lost. Gray dots are planets that have lost all H/He in the triangle of evaporation. The red line shows the upper limit at Rbare (a) given by Eq. (2). Just above the line, there is the valley of evaporation. Adapted from Jin et al. (2014).
Current usage metrics show cumulative count of Article Views (full-text article views including HTML views, PDF and ePub downloads, according to the available data) and Abstracts Views on Vision4Press platform.
Data correspond to usage on the plateform after 2015. The current usage metrics is available 48-96 hours after online publication and is updated daily on week days.
Initial download of the metrics may take a while.