Fig. D.1
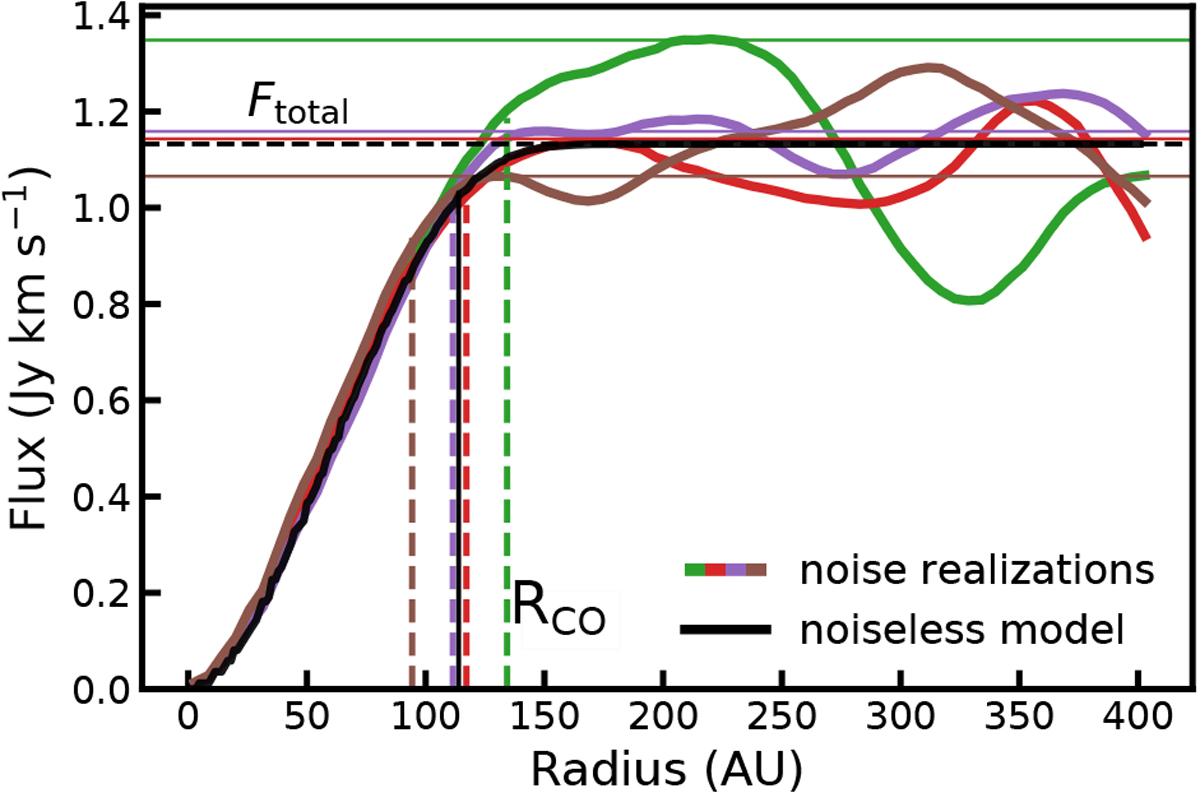
Curve of growth of the 12CO 2–1 emission for the Sz 129 model for four different and extreme noise realizations chosen to show the range of effects that noise can have on measuring the outer radius. For each noise realization, the horizontal lines show the total flux and the dashed vertical line shows the calculated outer radius. The curve of growth, total flux, and outer radius of the noiseless model are shown in black.
Current usage metrics show cumulative count of Article Views (full-text article views including HTML views, PDF and ePub downloads, according to the available data) and Abstracts Views on Vision4Press platform.
Data correspond to usage on the plateform after 2015. The current usage metrics is available 48-96 hours after online publication and is updated daily on week days.
Initial download of the metrics may take a while.