Fig. C.1
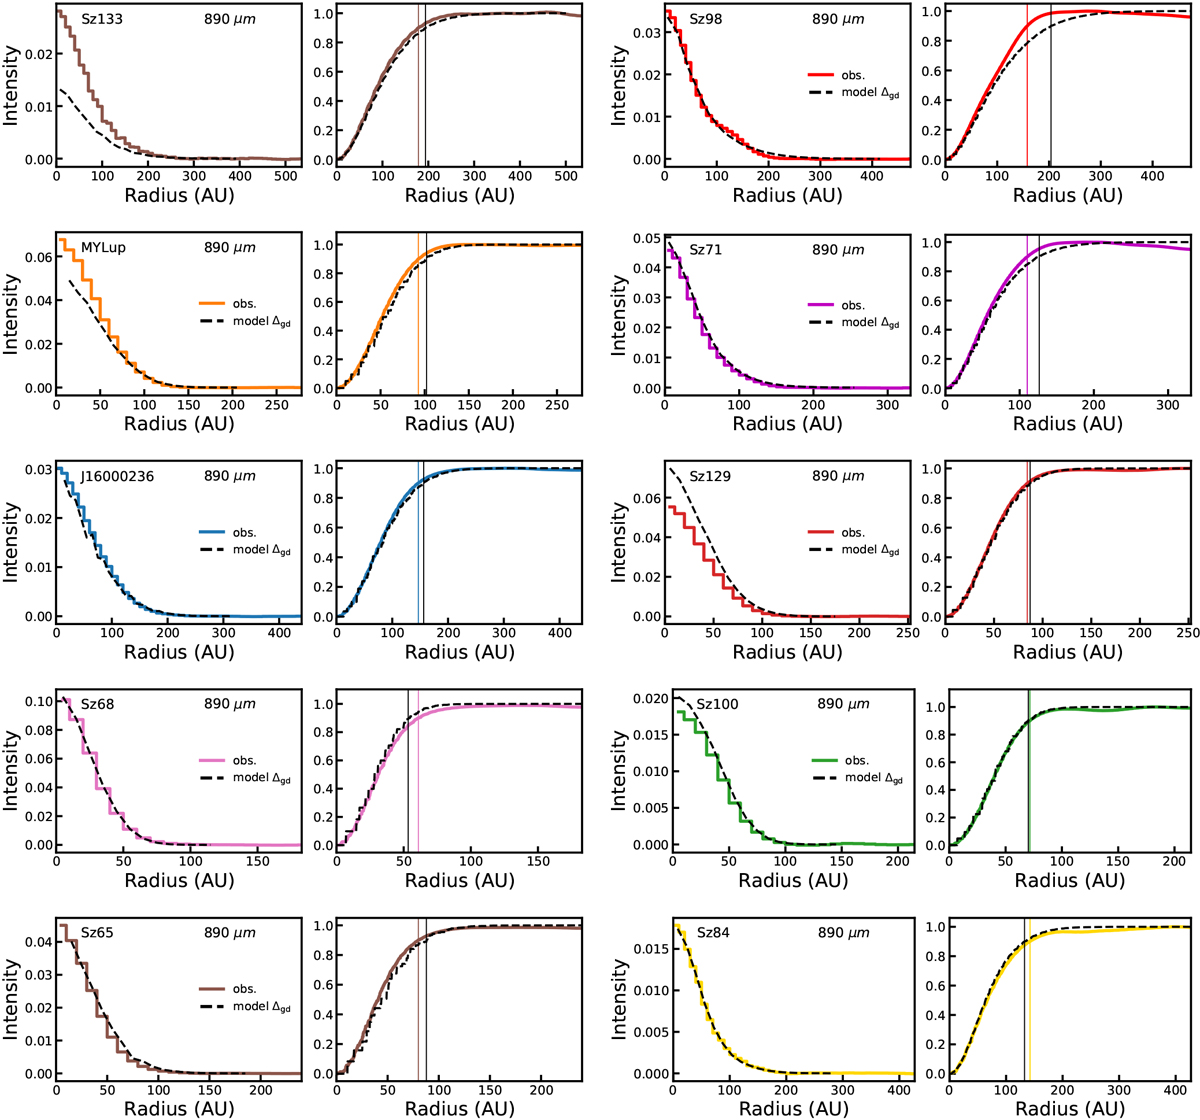
Comparison between model and observed 890 μm continuum intensity profiles for the ten sources in our sample. For each source, the left panel shows the intensity profile and the right panel shows the matching normalized curve of growth for both the model (black, dashed) and the observation (colored, solid). Vertical lines in the right panels show the radius that encloses 90% of the total flux (R890 μm). We note that the curve of growth of the model and the observation are normalized separately as the total flux is unimportantwhen measuring R890 μm.
Current usage metrics show cumulative count of Article Views (full-text article views including HTML views, PDF and ePub downloads, according to the available data) and Abstracts Views on Vision4Press platform.
Data correspond to usage on the plateform after 2015. The current usage metrics is available 48-96 hours after online publication and is updated daily on week days.
Initial download of the metrics may take a while.