Fig. 4
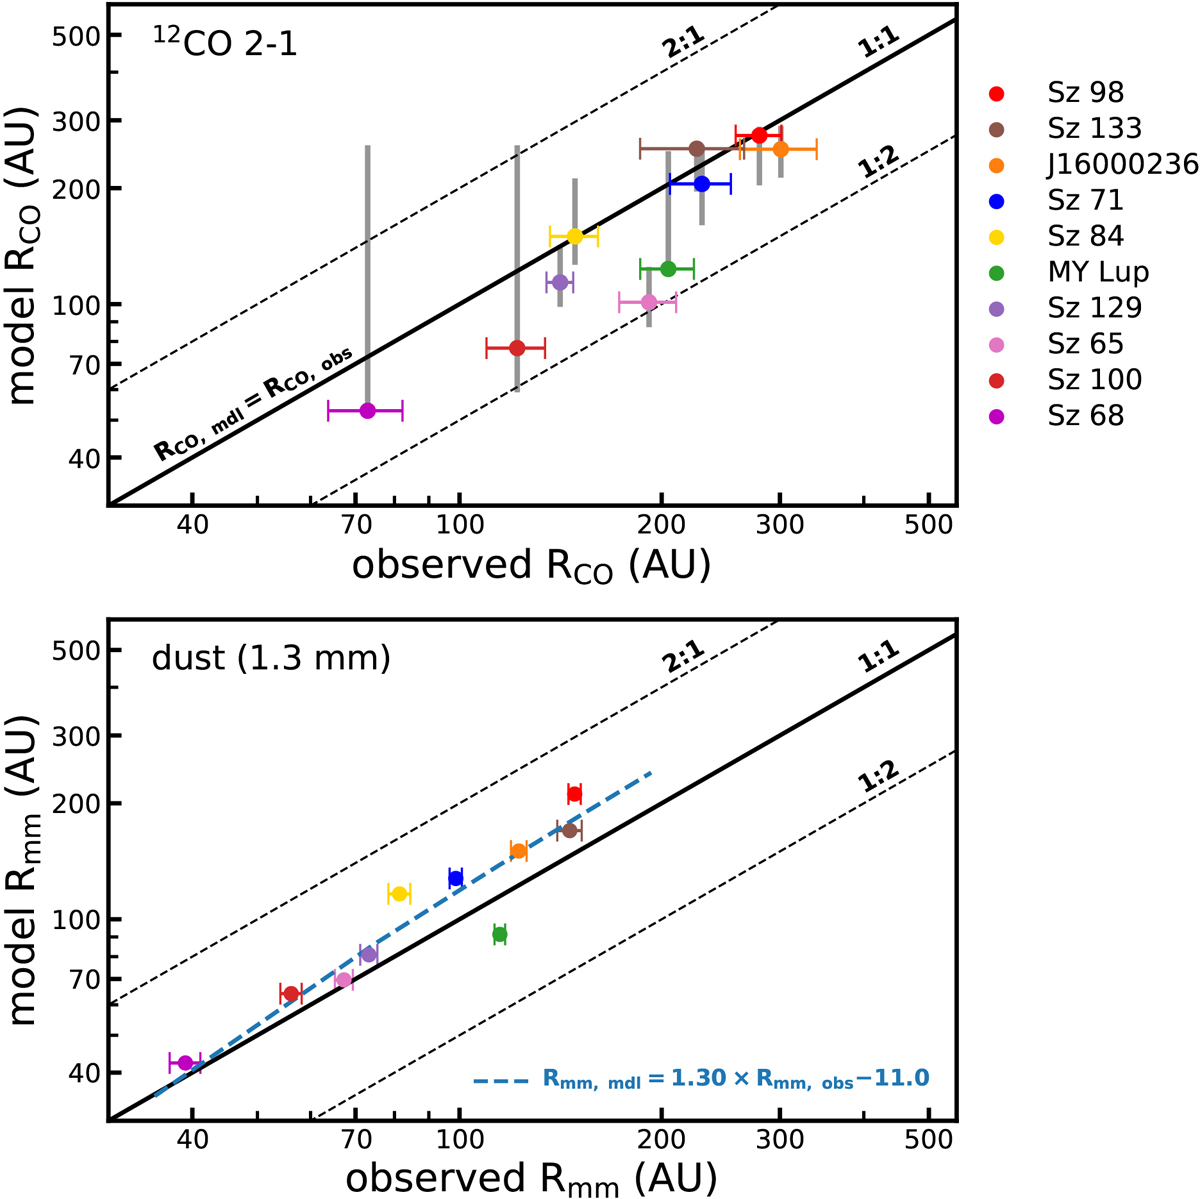
Disk size comparison of the models and the observations. Top panel: gas disk size (RCO), defined as the radius enclosing 90% of the 12CO J = 2− 1 flux. Observed RCO, including uncertainties, are shown as a colored error bar (Ansdell et al. 2018). Gray vertical lines denote the range of RCO, mdl measured after noise is included (see Appendix D). The upper and lower points of the gray line show the 84th and 16th quantiles, respectively, of the noisy RCO distribution (cf. Appendix E). Bottom panel: as above, but showing the dust disk size, defined as the radius that encloses 90% of the 1.3 mm continuum flux. The blue dashed line shows the best fit of the offset between Rmm, mdl and Rmm, obs (see Sect. 4.2).
Current usage metrics show cumulative count of Article Views (full-text article views including HTML views, PDF and ePub downloads, according to the available data) and Abstracts Views on Vision4Press platform.
Data correspond to usage on the plateform after 2015. The current usage metrics is available 48-96 hours after online publication and is updated daily on week days.
Initial download of the metrics may take a while.