Fig. 1
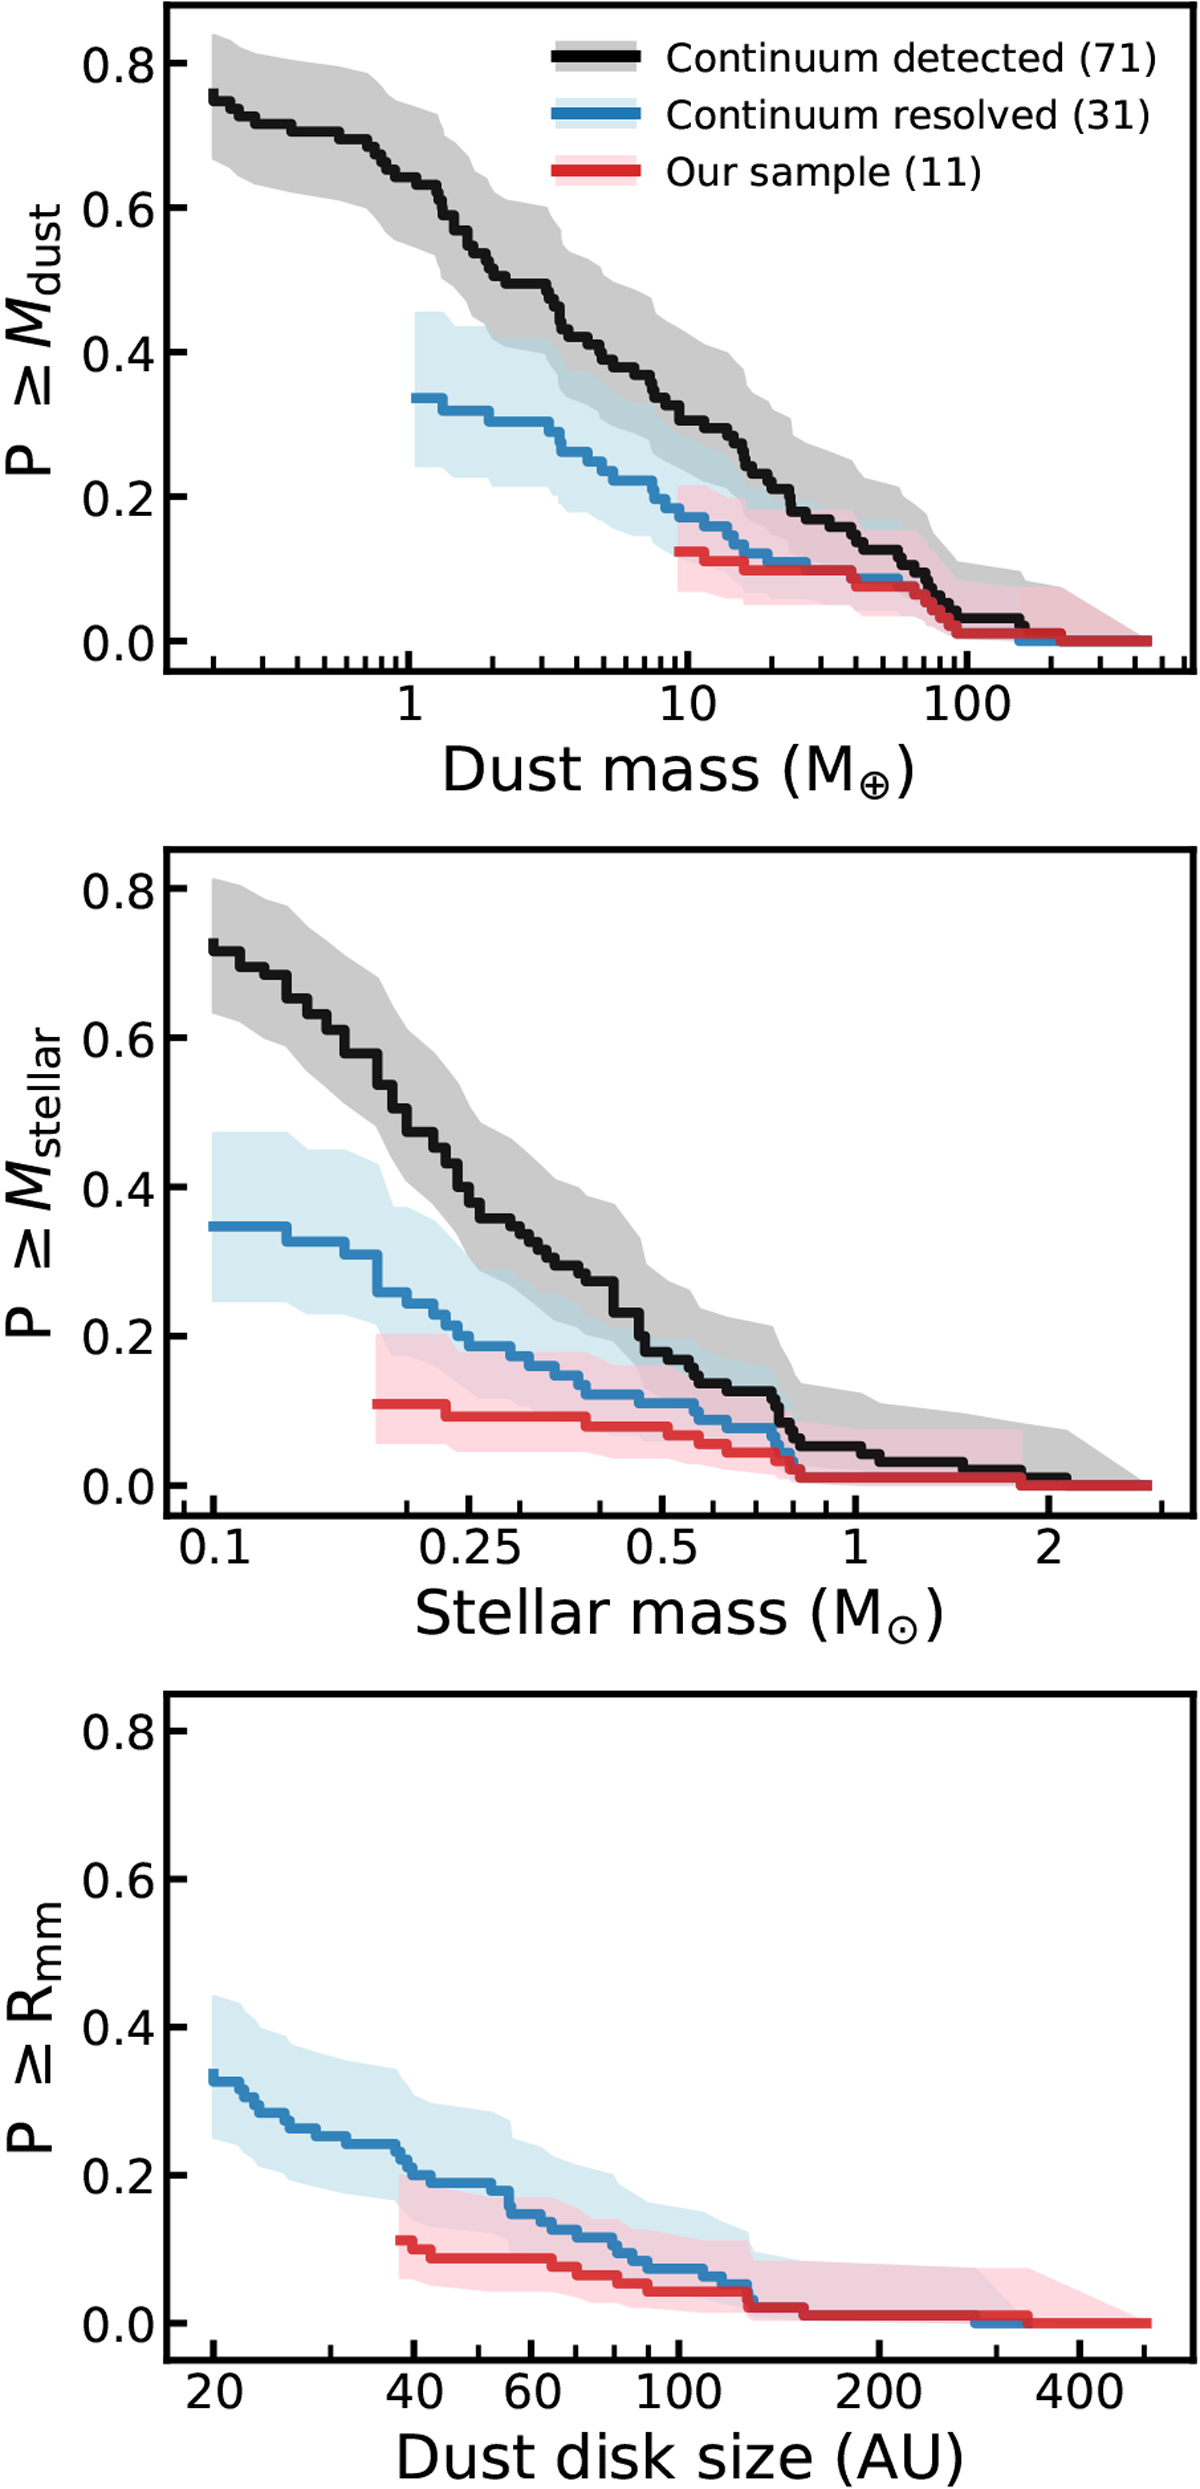
Cumulative distribution of our sample in relation to the full Lupus disk population. Top panel: dust masses taken from Ansdell et al. 2016 of all Lupus disks detected in continuum (gray), Lupus disks resolved in continuum (blue) and our sample (red; see Sect. 2.2). Middle panel: same as above, but showing stellar masses derived from X-shooter spectra Alcalá et al. (2017), but recalculated using the new Gaia DR2 distances (see Appendix A in Alcalá et al. 2019). Bottom panel: same as above, but showing dust outer radii (Rmm).
Current usage metrics show cumulative count of Article Views (full-text article views including HTML views, PDF and ePub downloads, according to the available data) and Abstracts Views on Vision4Press platform.
Data correspond to usage on the plateform after 2015. The current usage metrics is available 48-96 hours after online publication and is updated daily on week days.
Initial download of the metrics may take a while.