| Issue |
A&A
Volume 638, June 2020
|
|
|---|---|---|
| Article Number | C1 | |
| Number of page(s) | 1 | |
| Section | Stellar structure and evolution | |
| DOI | https://doi.org/10.1051/0004-6361/201528031e | |
| Published online | 29 May 2020 | |
On the effect of rotation on populations of classical Cepheids
II. Pulsation analysis for metallicities 0.014, 0.006, and 0.002 (Corrigendum)
1
European Southern Observatory, Karl-Schwarzschild-Str. 2, 85748 Garching b. München, Germany
e-mail: This email address is being protected from spambots. You need JavaScript enabled to view it.
2
Astronomical Institute, Graduate School of Science, Tohoku University, Sendai, Miyagi 980-8578, Japan
3
Département d’Astronomie, Université de Genève, 51 Ch. des Maillettes, 1290 Sauverny, Switzerland
Key words: stars: variables: Cepheids / supergiants / stars: oscillations / stars: evolution / stars: rotation / errata, addenda
ESO fellow.
Figure 17 of Anderson et al. (2016) contained an unfortunate plotting error. The python script used to create the plot showing flux-weighted gravity (FWG) values contained a typo (a missing asterisk), leading us to plot log(g/(Teff, 4 ⋅ 4)) instead of the correct  for empirical values based on spectroscopic observations. The theoretical predictions were shown correctly. The devious typo led to a spurious disagreement between the predicted and empirically determined FWG-period relations at long periods.
Figure 1 shows the corrected version of our previous Fig. 17. We additionally improved the figure by plotting mean values for FWG determined by a sinusoidal fit to the FWG time series instead of the previously shown, and cruder, center values of FWG determined using the range of Teff and log g. The error bars shown now represent the amplitude of the fitted sine function.
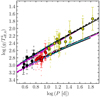 |
Fig. 1. Flux-weighted gravity-period relation of fundamental mode classical Cepheids. Solar metallicity predictions (Z = 0.014) are shown using different line styles (dash-dotted, solid, and dashed) for different initial rotation rates (non-rotating, average, fast), while crossing numbers (first, second, and third) are distinguished using color (magenta, cyan, and black). Empirical values based on spectroscopic observations of Milky Way Cepheids by Luck & Andrievsky (2004), Andrievsky et al. (2005), and Kovtyukh et al. (2005) are shown as circles. FWG time-series data are drawn as transparent circles. Solid circles show the average of sinusoidal fits to the time-series data, with error bars indicating the amplitude of the fitted sine function. |
As discussed in Anderson et al. (2016),  , that is, the flux-weighted gravity directly tests the mass-luminosity relation (Meynet et al. 2015). The corrected Fig. 1 thus demonstrates that the Cepheid mass-luminosity relation predicted by Solar-metallicity Geneva stellar evolution models (Ekström et al. 2012; Georgy et al. 2013) successfully passes the empirical test provided by the spectroscopic flux-weighted gravity of Milky Way Cepheids.
References
- Anderson, R. I., Saio, H., Ekström, S., Georgy, C., & Meynet, G. 2016, A&A, 591, A8 [NASA ADS] [CrossRef] [EDP Sciences] [Google Scholar]
- Andrievsky, S. M., Luck, R. E., & Kovtyukh, V. V. 2005, AJ, 130, 1880 [NASA ADS] [CrossRef] [Google Scholar]
- Ekström, S., Georgy, C., Eggenberger, P., et al. 2012, A&A, 537, A146 [NASA ADS] [CrossRef] [EDP Sciences] [Google Scholar]
- Georgy, C., Ekström, S., Granada, A., et al. 2013, A&A, 553, A24 [NASA ADS] [CrossRef] [EDP Sciences] [Google Scholar]
- Kovtyukh, V. V., Andrievsky, S. M., Belik, S. I., & Luck, R. E. 2005, AJ, 129, 433 [NASA ADS] [CrossRef] [Google Scholar]
- Luck, R. E., & Andrievsky, S. M. 2004, AJ, 128, 343 [NASA ADS] [CrossRef] [MathSciNet] [Google Scholar]
- Meynet, G., Kudritzki, R.-P., & Georgy, C. 2015, A&A, 581, A36 [NASA ADS] [CrossRef] [EDP Sciences] [Google Scholar]
© ESO 2020
All Figures
|
Fig. 1. Flux-weighted gravity-period relation of fundamental mode classical Cepheids. Solar metallicity predictions (Z = 0.014) are shown using different line styles (dash-dotted, solid, and dashed) for different initial rotation rates (non-rotating, average, fast), while crossing numbers (first, second, and third) are distinguished using color (magenta, cyan, and black). Empirical values based on spectroscopic observations of Milky Way Cepheids by Luck & Andrievsky (2004), Andrievsky et al. (2005), and Kovtyukh et al. (2005) are shown as circles. FWG time-series data are drawn as transparent circles. Solid circles show the average of sinusoidal fits to the time-series data, with error bars indicating the amplitude of the fitted sine function. |
| In the text | |
Current usage metrics show cumulative count of Article Views (full-text article views including HTML views, PDF and ePub downloads, according to the available data) and Abstracts Views on Vision4Press platform.
Data correspond to usage on the plateform after 2015. The current usage metrics is available 48-96 hours after online publication and is updated daily on week days.
Initial download of the metrics may take a while.