Free Access
Fig. 2.
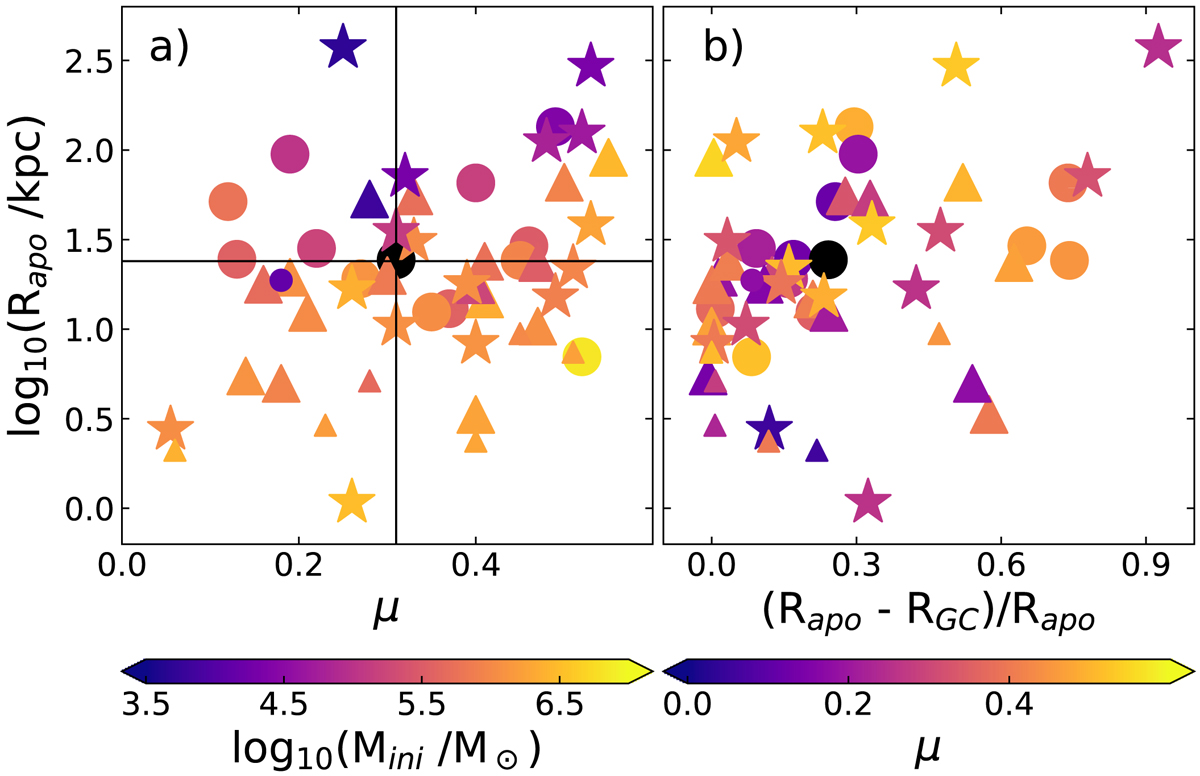
Relationships between different position and mass-related parameters for the globular clusters in groups G1, G2, and G3. Symbols are the same as in Fig. 1. Panel a is divided into four quadrants as in Fig. 5 from Balbinot & Gieles (2018). Pal 5 is represented by a large black filled circle.
Current usage metrics show cumulative count of Article Views (full-text article views including HTML views, PDF and ePub downloads, according to the available data) and Abstracts Views on Vision4Press platform.
Data correspond to usage on the plateform after 2015. The current usage metrics is available 48-96 hours after online publication and is updated daily on week days.
Initial download of the metrics may take a while.