Fig. 1.
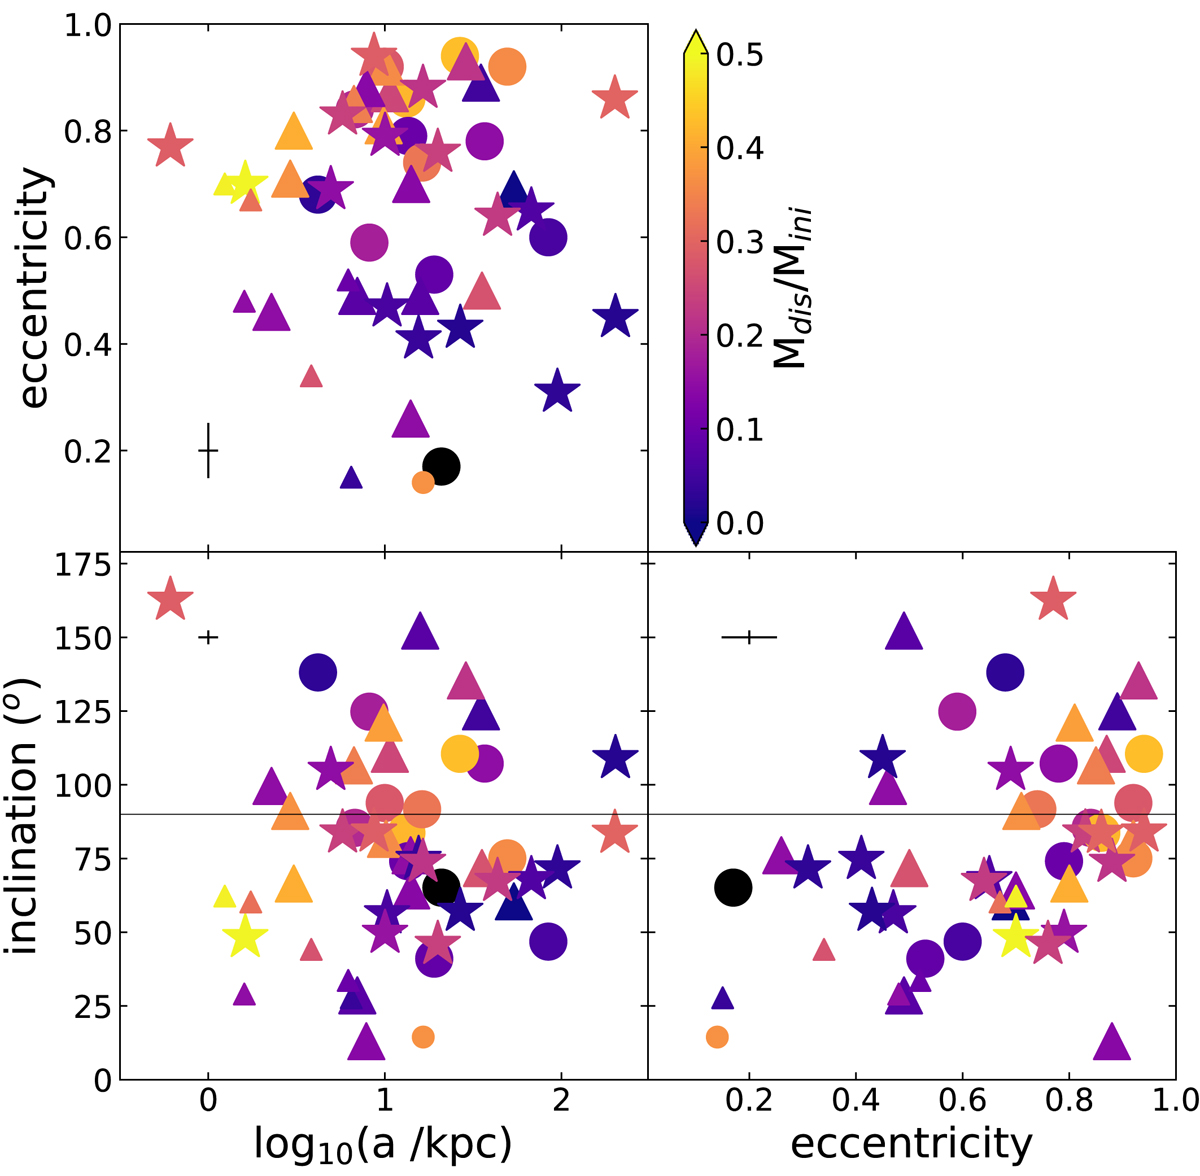
Relationship between the semimajor axis, the eccentricity, and the orbital inclination for globular clusters in groups G1, G2, and G3, drawn with filled circles, triangles, and stars, respectively. Large and small symbols refer to clusters with an accreted origin or those that formed in situ, respectively, according to Massari et al. (2019). The horizontal line in the bottom panels (inclination = 90°) splits them into the prograde (inclination < 90°) and retrograde (inclination > 90°) regimes (see Piatti 2019). Color bar represents the ratio of the cluster mass lost by disruption to the total initial mass (see Piatti et al. 2019). Error bars are also included. Pal 5 is represented by a large black filled circle.
Current usage metrics show cumulative count of Article Views (full-text article views including HTML views, PDF and ePub downloads, according to the available data) and Abstracts Views on Vision4Press platform.
Data correspond to usage on the plateform after 2015. The current usage metrics is available 48-96 hours after online publication and is updated daily on week days.
Initial download of the metrics may take a while.