Fig. 8
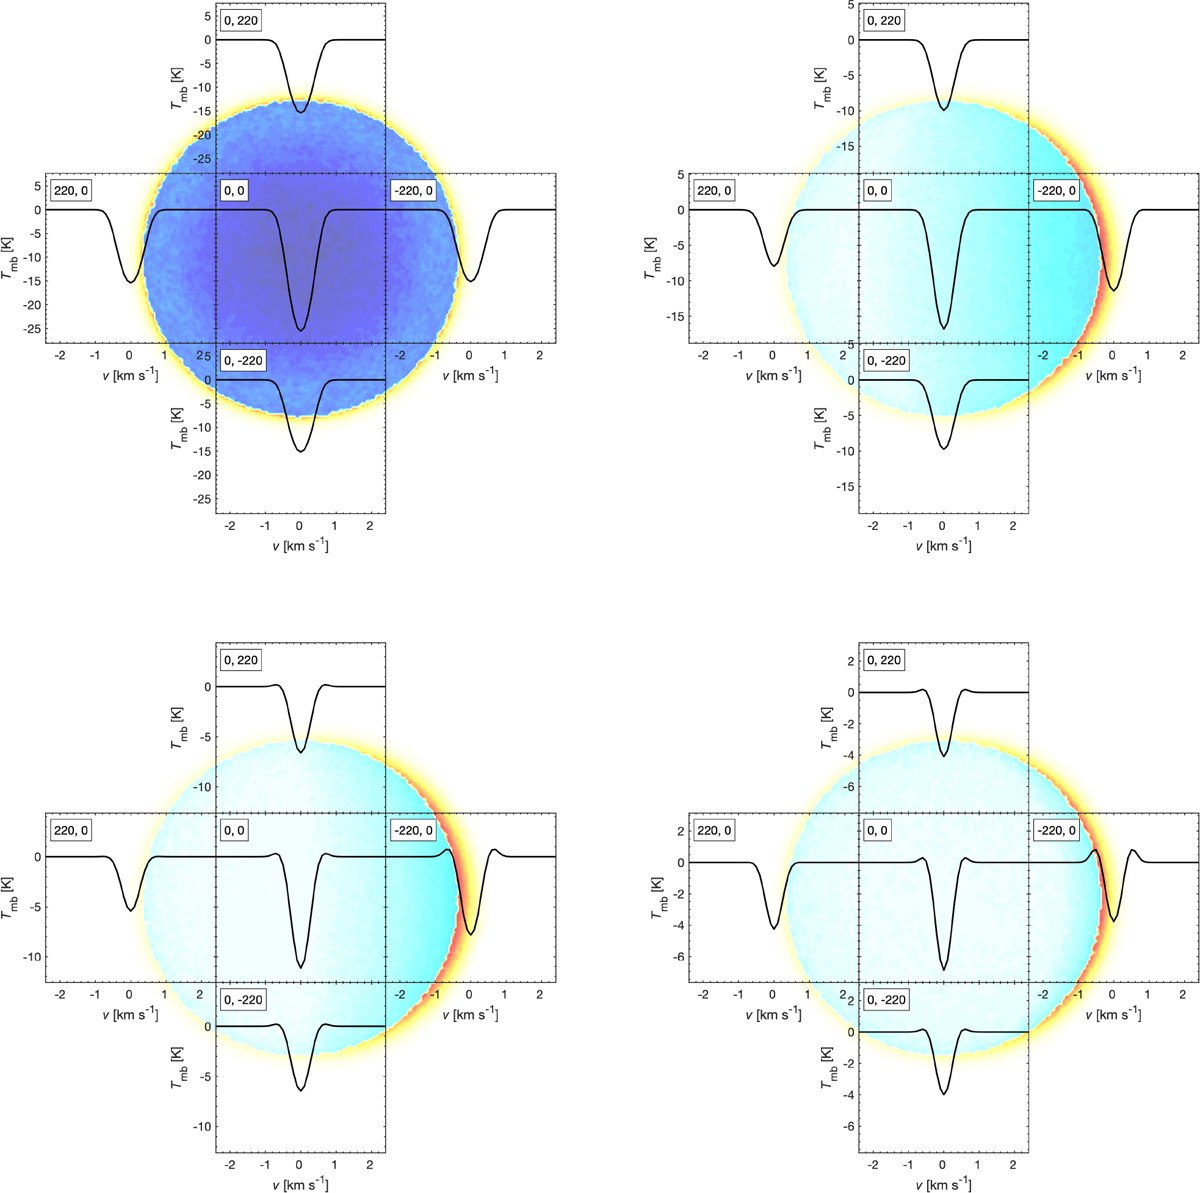
Upper left panel: five-point map towards Ganymede at a distance of 2.7 × 10⁶ m (case II). The phase angle is 0°. Baseline-subtracted spectra are overlaid on a moment-zero map, where light cyan to dark blue regions correspond to increasing absorption, and light yellow to dark red regions correspond to increasing emission. The linear colour scale is normalised to either the position where the integrated intensity is highest or lowest, depending on which attains the greatest absolute value (hence the varying colours in the figures throughout this paper), and white always corresponds to neither absorption nor emission. The moment-zero map is presented at full resolution where each pixel correspond to 6′′. Upper right panel: same as the upper left panel, but for a phase angle of 60°. Lower left panel: same as the upper left panel, but for a phase angle of 90°. Lower right panel: same as the upper left panel, but for a phase angle of 135°.
Current usage metrics show cumulative count of Article Views (full-text article views including HTML views, PDF and ePub downloads, according to the available data) and Abstracts Views on Vision4Press platform.
Data correspond to usage on the plateform after 2015. The current usage metrics is available 48-96 hours after online publication and is updated daily on week days.
Initial download of the metrics may take a while.