Fig. 7.
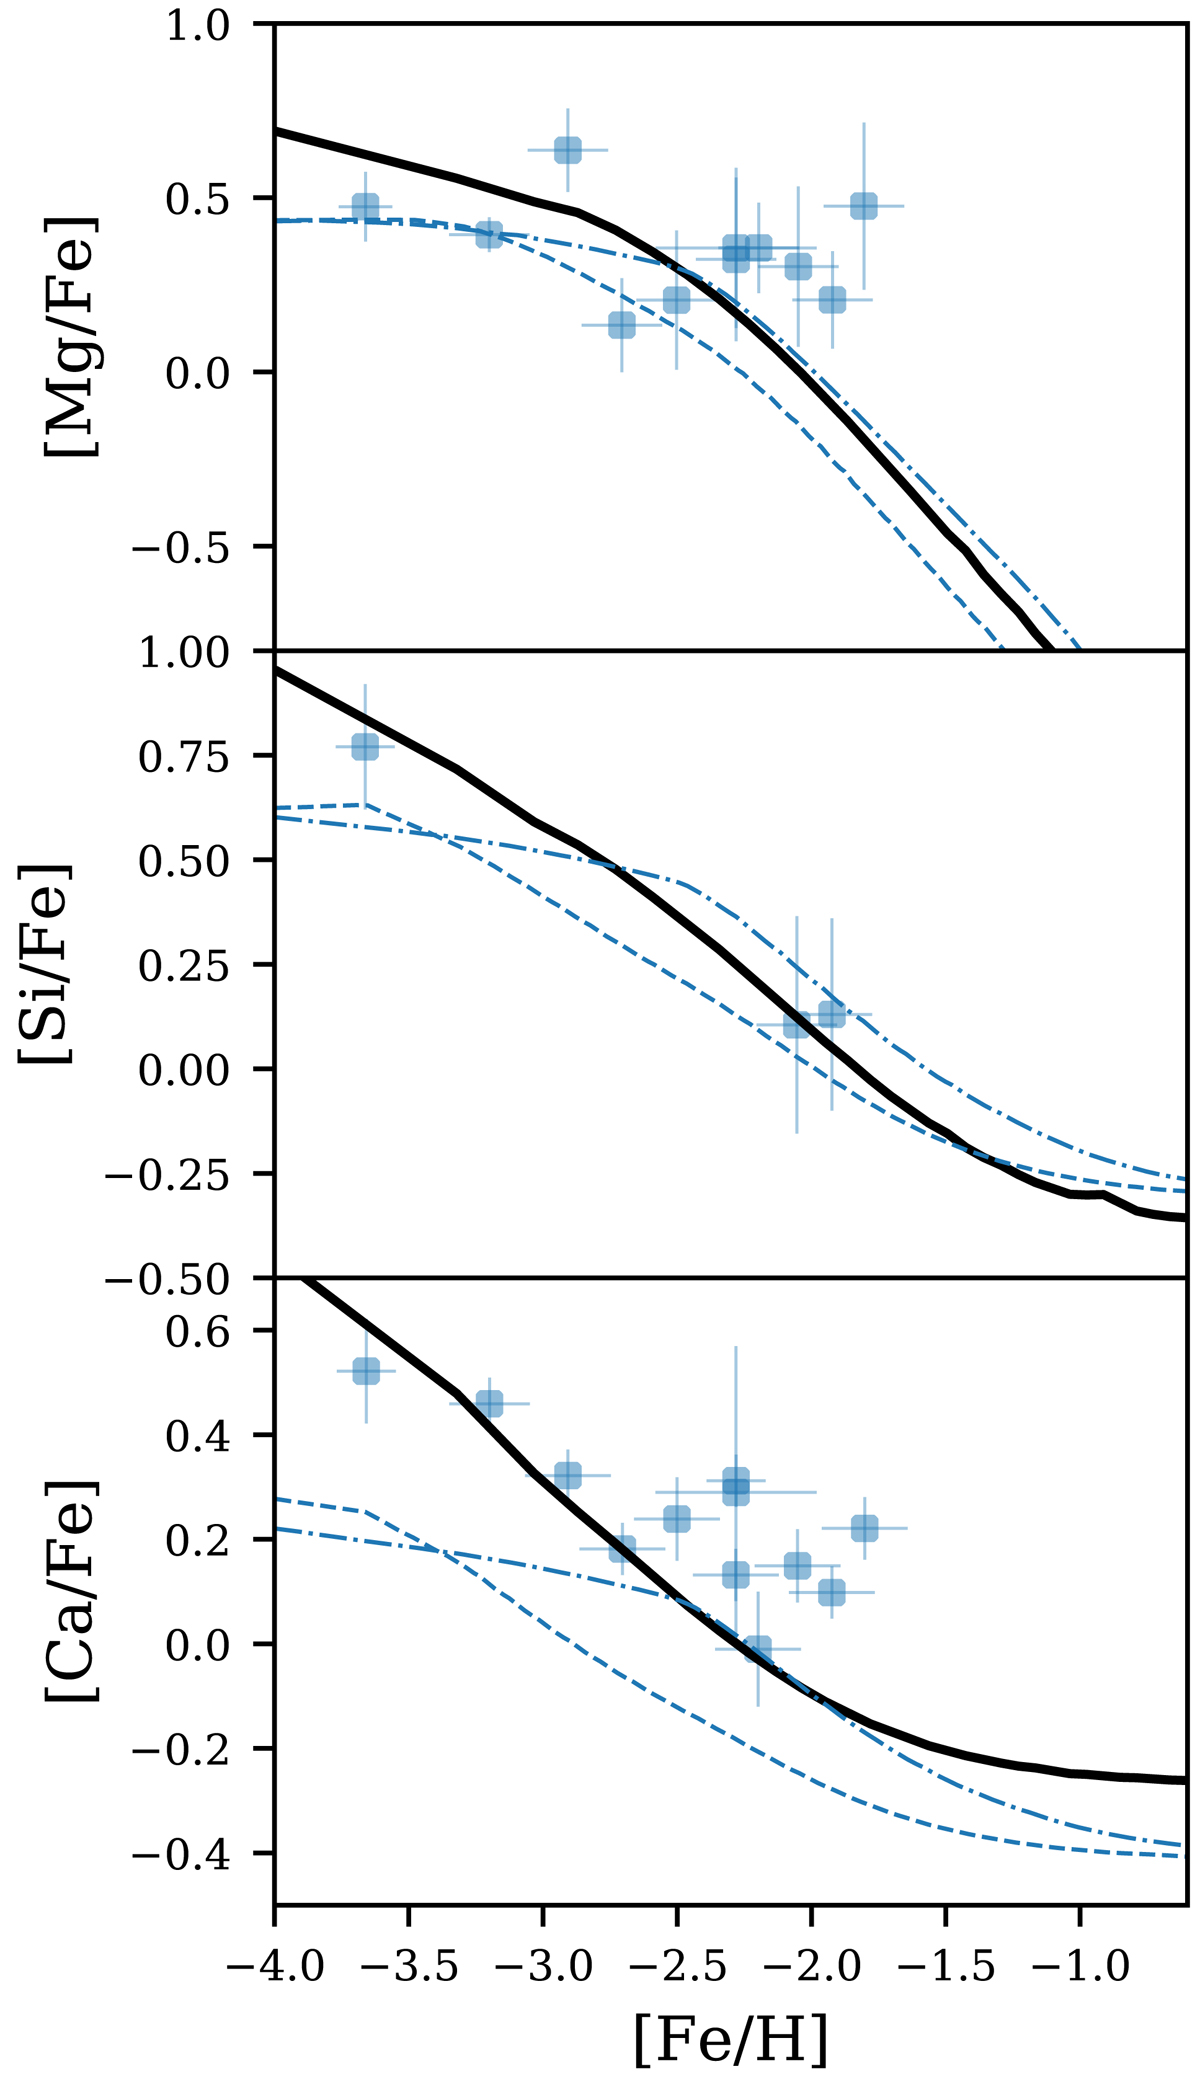
Evolution of [α/Fe]–[Fe/H] relations of the best-fit IGIMF-R14 model (black solid line). The circles are the data of Boötes I collected in Lacchin et al. (2020, their Fig. 6). The dashed line and the dash-dotted line are the two 3BooI models in Lacchin et al. (2020, their Fig. 6), assuming the gwIMF given by IGIMF-R14 and the Salpeter IMF, respectively.
Current usage metrics show cumulative count of Article Views (full-text article views including HTML views, PDF and ePub downloads, according to the available data) and Abstracts Views on Vision4Press platform.
Data correspond to usage on the plateform after 2015. The current usage metrics is available 48-96 hours after online publication and is updated daily on week days.
Initial download of the metrics may take a while.