Fig. 3.
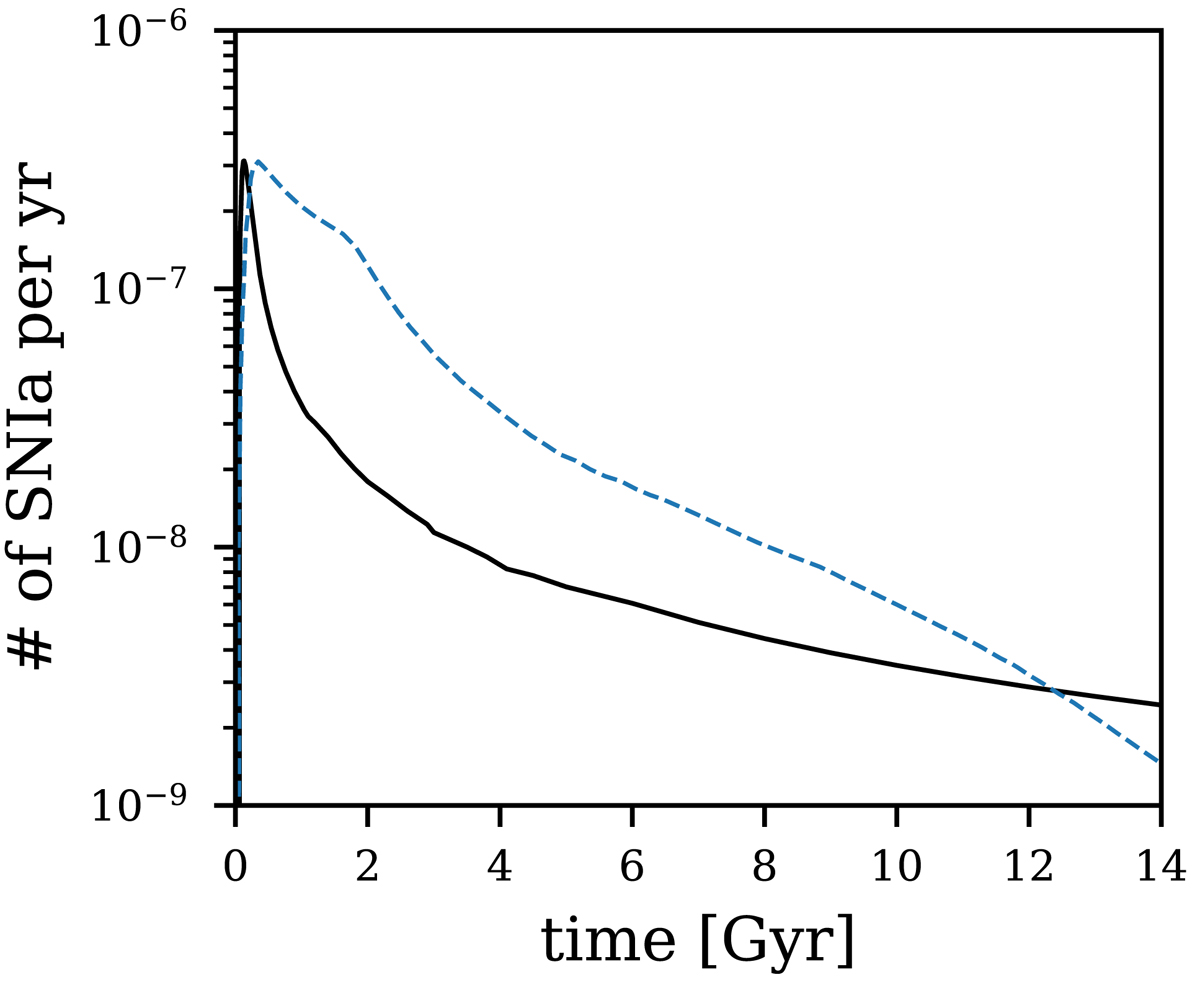
Evolution history of the SNIa rate. Similar to Fig. 1, but for the SNIa rate of the best-fit IGIMF-R14 model. The blue dashed line is the blue dashed line in Lacchin et al. (2020, their Fig. 4), i.e., their 3BooI-IGIMF model. We note that the horizontal axis is different from Fig. 2. We also tested the DTD assumption of Lacchin et al. (2020) in our IGIMF-R14-SD model, shown in Fig. A.3.
Current usage metrics show cumulative count of Article Views (full-text article views including HTML views, PDF and ePub downloads, according to the available data) and Abstracts Views on Vision4Press platform.
Data correspond to usage on the plateform after 2015. The current usage metrics is available 48-96 hours after online publication and is updated daily on week days.
Initial download of the metrics may take a while.