Fig. 2.
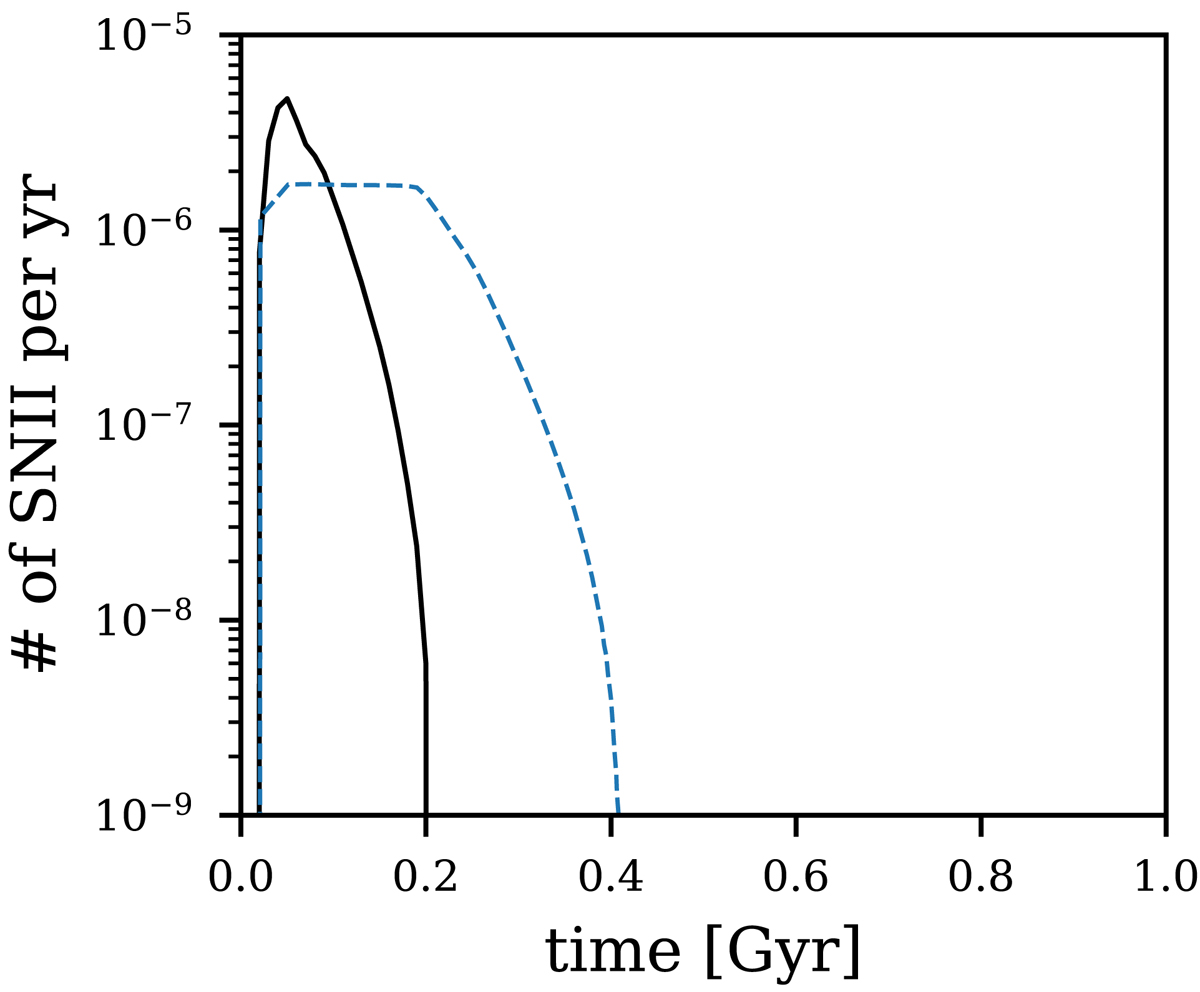
Evolution history of the SNII rate. Similar to Fig. 1, but for the SNII rate of the best-fit IGIMF-R14 model. The initial spike SNII rate is due to the discontinuous 10 Myr time step where the metallicity increases from [Z] = − 7 to [Z] = − 4 at the second time step that leads to a sudden change in gwIMF according to the IGIMF-R14 formulation (see Fig. 4). The blue dashed line is the blue dashed line in Lacchin et al. (2020, their Fig. 5), i.e., their 3BooI-IGIMF model.
Current usage metrics show cumulative count of Article Views (full-text article views including HTML views, PDF and ePub downloads, according to the available data) and Abstracts Views on Vision4Press platform.
Data correspond to usage on the plateform after 2015. The current usage metrics is available 48-96 hours after online publication and is updated daily on week days.
Initial download of the metrics may take a while.