Fig. 6.
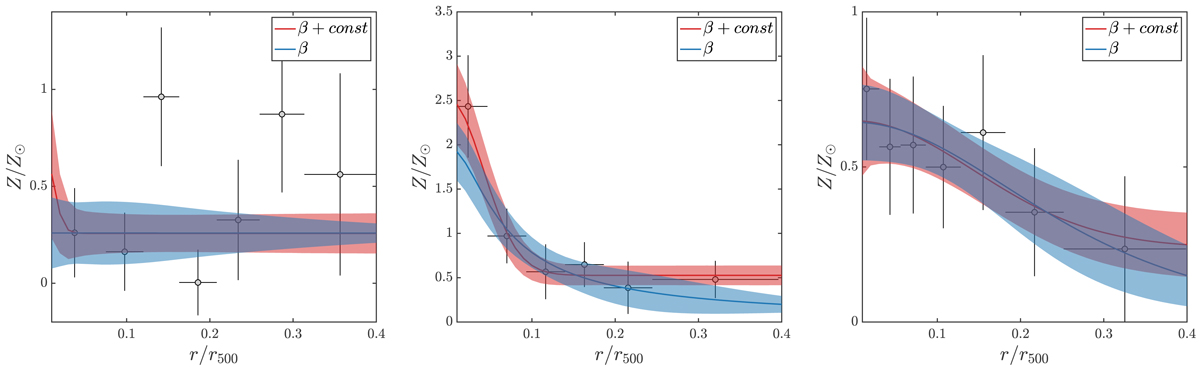
Examples of abundance profiles with the corresponding double-component (red) and single-component (blue) best-fit models. From left to right: Abell 2050, CLJ1415+3612, and PSZ2 G241.77−24.00. The three examples are extracted from the yellow, red, and blue dots in Fig. 5, which are clusters that: cannot be fitted with either model (yellow); favor the double-component model (red); and can be fitted with both models in the observed radial range (blue). The best-fit values and uncertainties (of all the curve fittings in this paper, unless noted otherwise) are obtained using the MCMC tool of Foreman-Mackey et al. (2013).
Current usage metrics show cumulative count of Article Views (full-text article views including HTML views, PDF and ePub downloads, according to the available data) and Abstracts Views on Vision4Press platform.
Data correspond to usage on the plateform after 2015. The current usage metrics is available 48-96 hours after online publication and is updated daily on week days.
Initial download of the metrics may take a while.