Fig. 5.
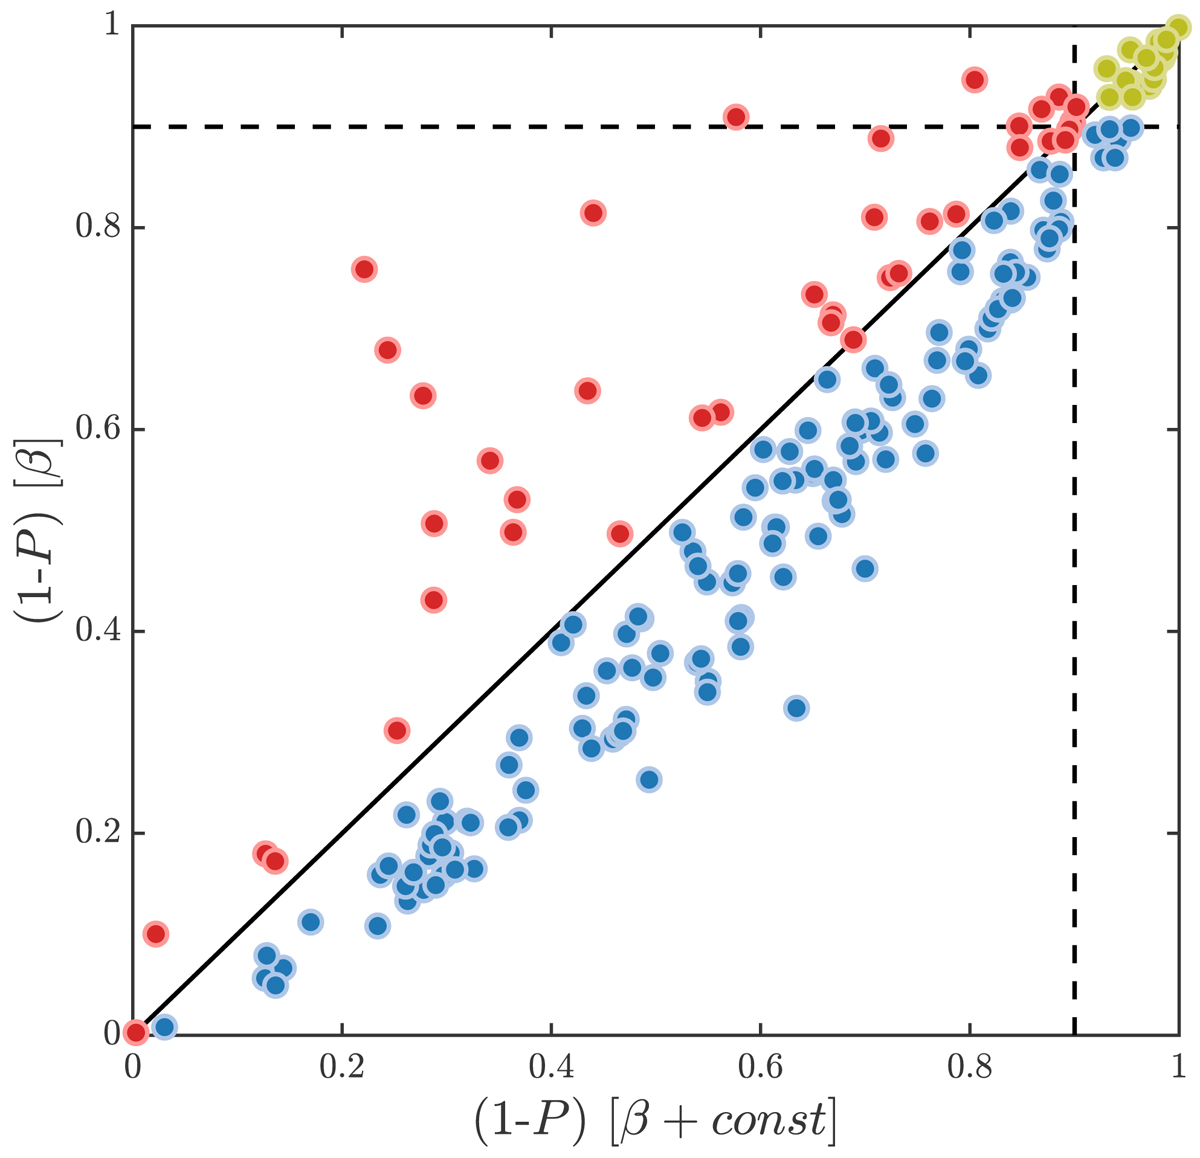
Probability of rejection of the abundance profiles with and without the iron plateau. The dashed lines mark (1 − P) = 0.90, hence the yellow points shows clusters for which both the single- and double-component models are rejected at >90% c.l. Clusters colored in red favor the double-component model, while both models provide similar quality fits to the clusters colored in blue. In these cases, the double-component model returns a slightly lower goodness because of the inclusion of an additional parameter in the fit.
Current usage metrics show cumulative count of Article Views (full-text article views including HTML views, PDF and ePub downloads, according to the available data) and Abstracts Views on Vision4Press platform.
Data correspond to usage on the plateform after 2015. The current usage metrics is available 48-96 hours after online publication and is updated daily on week days.
Initial download of the metrics may take a while.