Fig. 4.
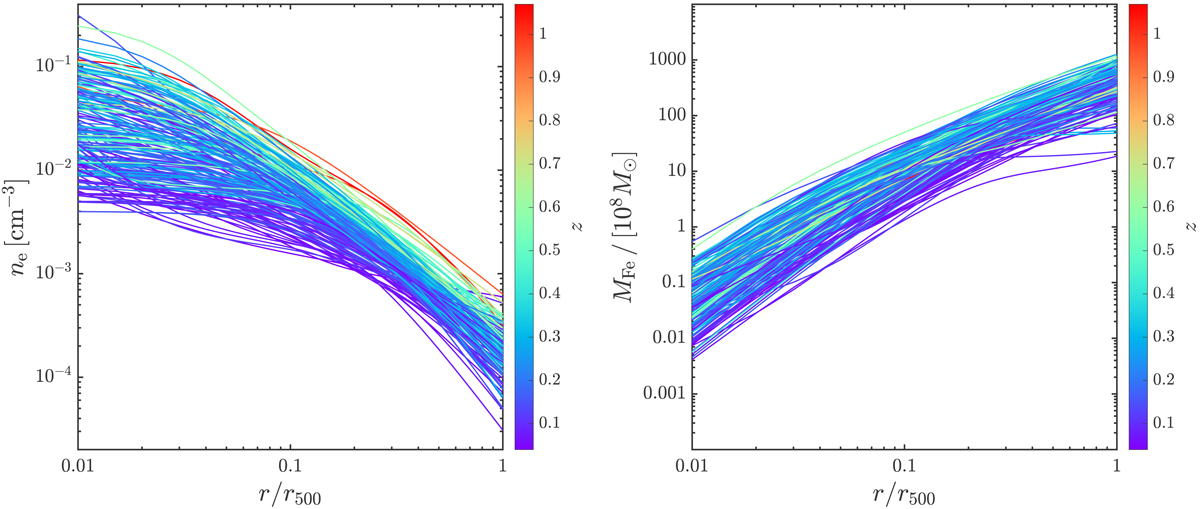
Left panel: best-fit double-β model of the deprojected density profiles, color-coded by redshift, for all the clusters in our sample. Right panel: total iron mass profiles obtained by convolving the gas density profile with the best fit abundance profile for each cluster in our sample. At r > 0.4r500 the iron mass is computed extrapolating the constant plateau up to r500.
Current usage metrics show cumulative count of Article Views (full-text article views including HTML views, PDF and ePub downloads, according to the available data) and Abstracts Views on Vision4Press platform.
Data correspond to usage on the plateform after 2015. The current usage metrics is available 48-96 hours after online publication and is updated daily on week days.
Initial download of the metrics may take a while.