Free Access
Fig. 2.
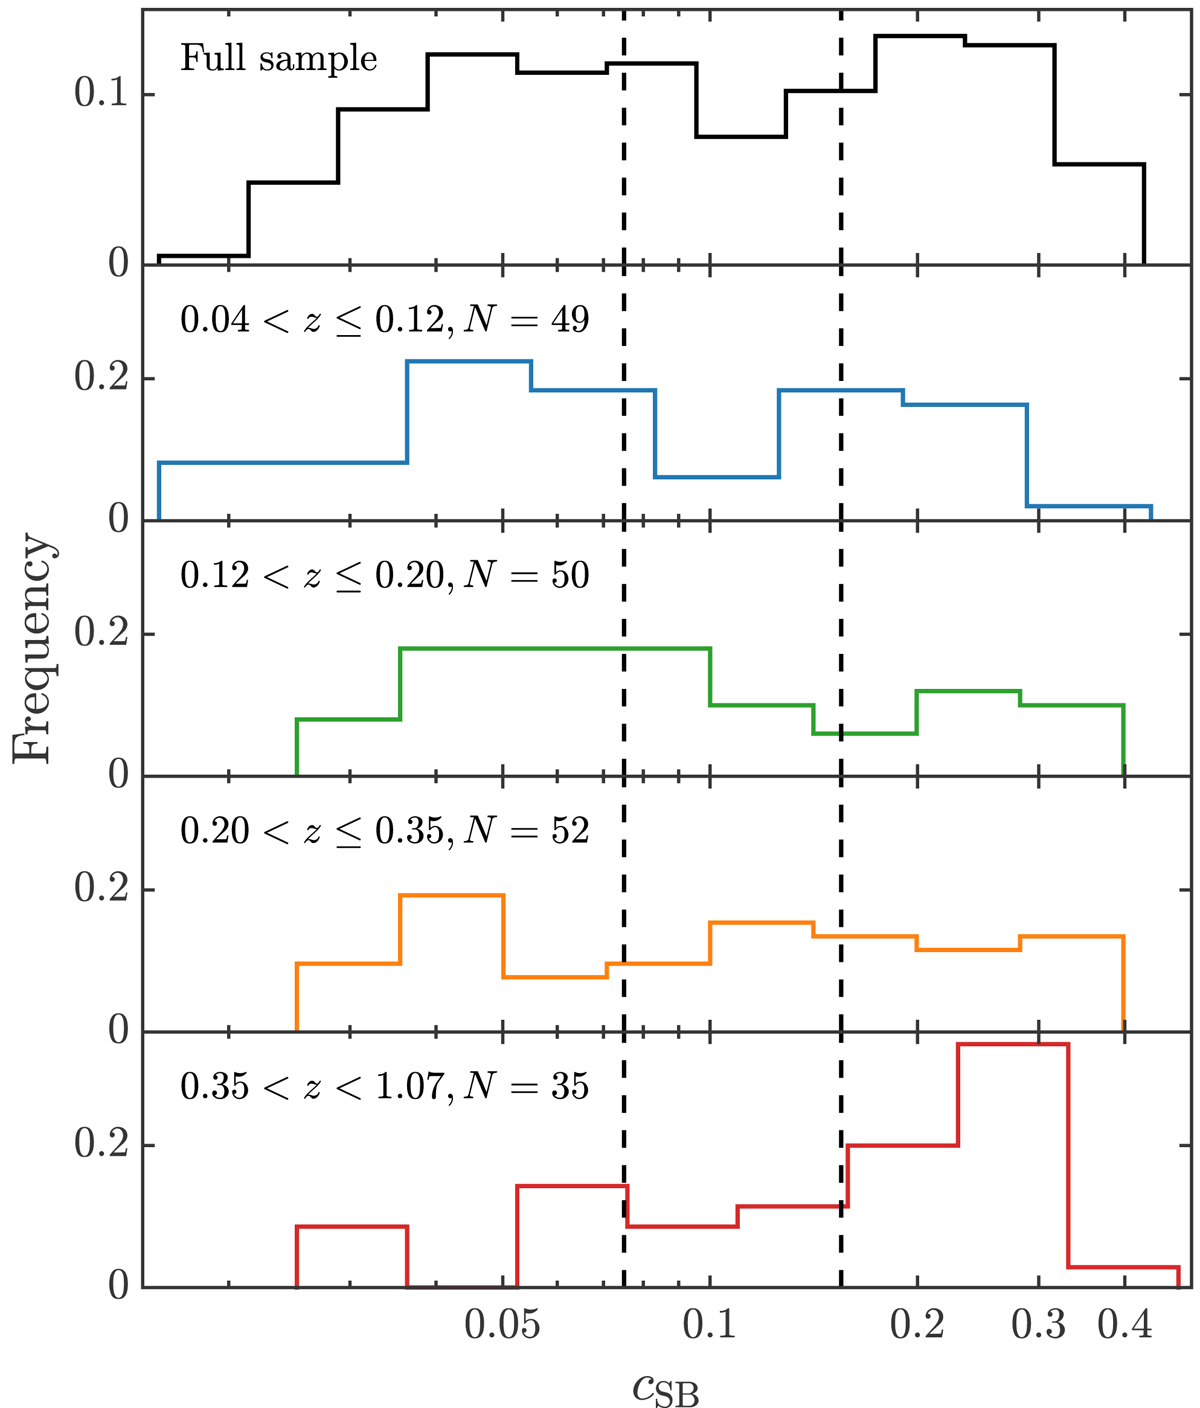
Distribution of the surface brightness concentration cSB of the clusters in the full sample and in 4 independent redshift bins with roughly the same number of clusters (N). The vertical dashed lines indicate the threshold for non-cool-core and weak cool-core clusters: cSB = 0.075 and cSB = 0.155.
Current usage metrics show cumulative count of Article Views (full-text article views including HTML views, PDF and ePub downloads, according to the available data) and Abstracts Views on Vision4Press platform.
Data correspond to usage on the plateform after 2015. The current usage metrics is available 48-96 hours after online publication and is updated daily on week days.
Initial download of the metrics may take a while.