Fig. 17.
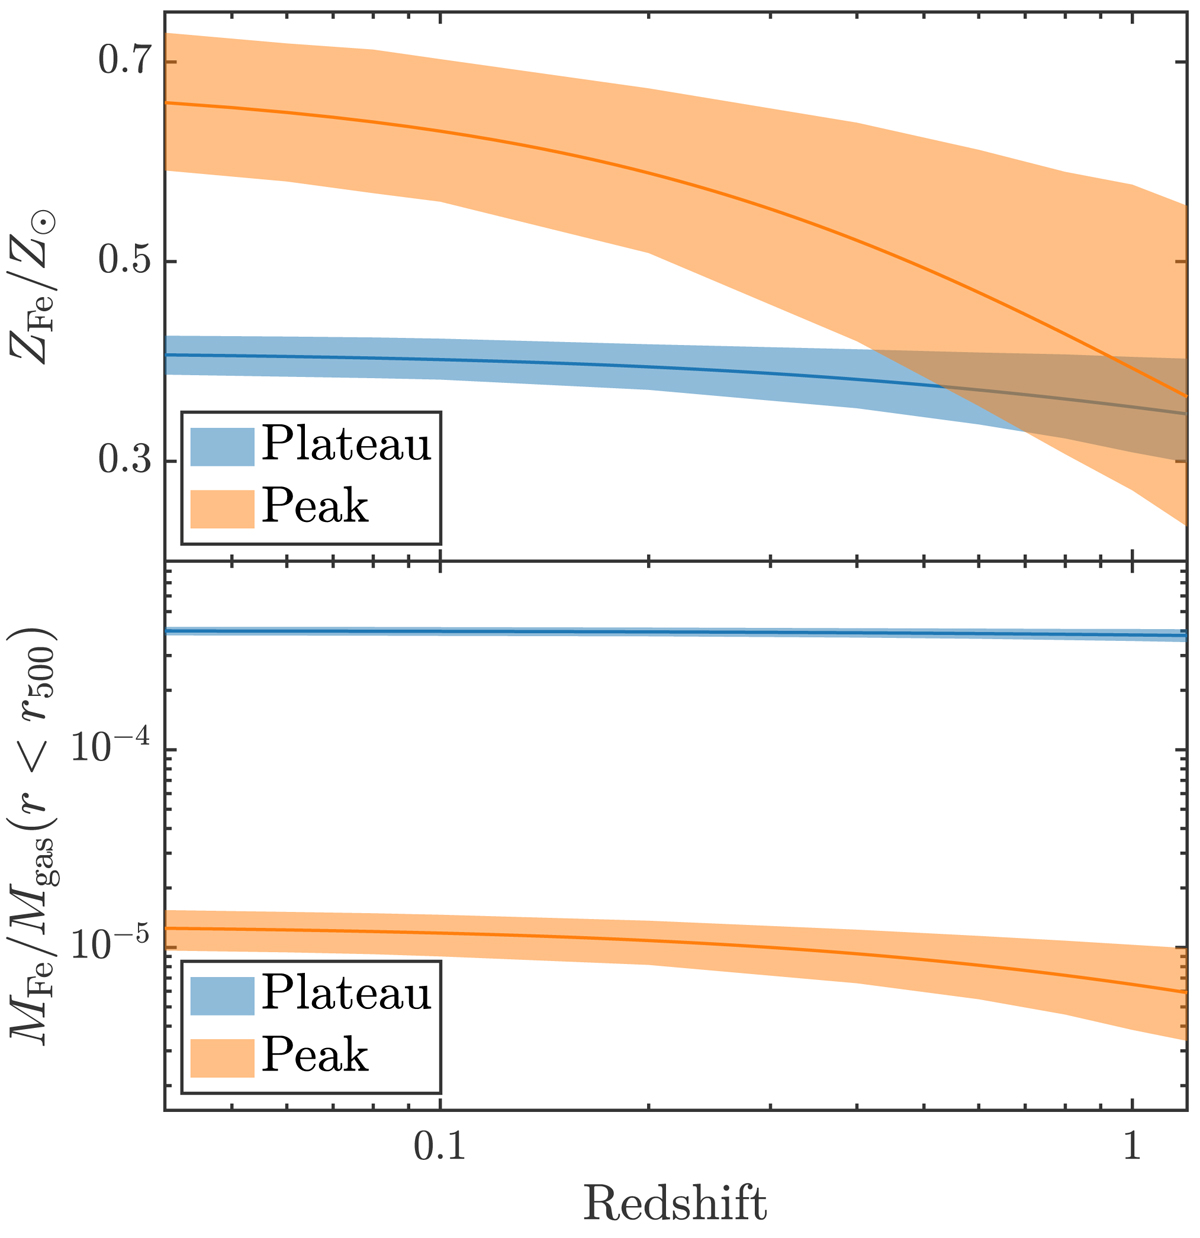
Upper panel: dependence of ![]() and
and ![]() on redshift as described by the best-fit power-law X = n ⋅ (1 + z)−γ, with its 1σ uncertainty. Lower panel: dependence of
on redshift as described by the best-fit power-law X = n ⋅ (1 + z)−γ, with its 1σ uncertainty. Lower panel: dependence of ![]() and
and ![]() on redshift. These two plots represent a synthetic description of the cosmic evolution of the iron abundance obtained in this work. The curves and shaded areas have been already shown in the right panels of Fig. 11 and the upper panels of Fig. 12.
on redshift. These two plots represent a synthetic description of the cosmic evolution of the iron abundance obtained in this work. The curves and shaded areas have been already shown in the right panels of Fig. 11 and the upper panels of Fig. 12.
Current usage metrics show cumulative count of Article Views (full-text article views including HTML views, PDF and ePub downloads, according to the available data) and Abstracts Views on Vision4Press platform.
Data correspond to usage on the plateform after 2015. The current usage metrics is available 48-96 hours after online publication and is updated daily on week days.
Initial download of the metrics may take a while.