Fig. 13.
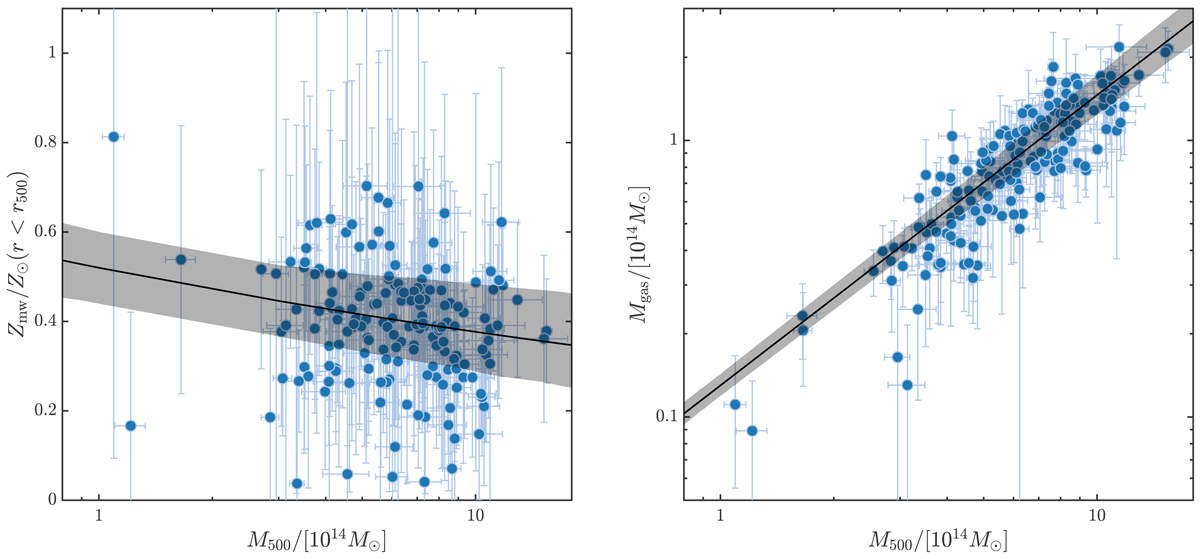
Left: correlation between gas mass-weighted abundance within r500 and the total mass M500 for all the clusters in the sample. The black curve and shaded area denote the best fit function and the 1σ confidence interval: Zmw = (0.52 ± 0.08)⋅(M500/1014 M⊙)−0.14 ± 0.09. Right: correlation between the gas mass and M500. The black curve and shaded area denote the best fit function and the 1σ confidence interval: Mgas/1014 M⊙ = (0.131 ± 0.012)⋅(M500/1014 M⊙)1.05 ± 0.06.
Current usage metrics show cumulative count of Article Views (full-text article views including HTML views, PDF and ePub downloads, according to the available data) and Abstracts Views on Vision4Press platform.
Data correspond to usage on the plateform after 2015. The current usage metrics is available 48-96 hours after online publication and is updated daily on week days.
Initial download of the metrics may take a while.