Fig. 11.
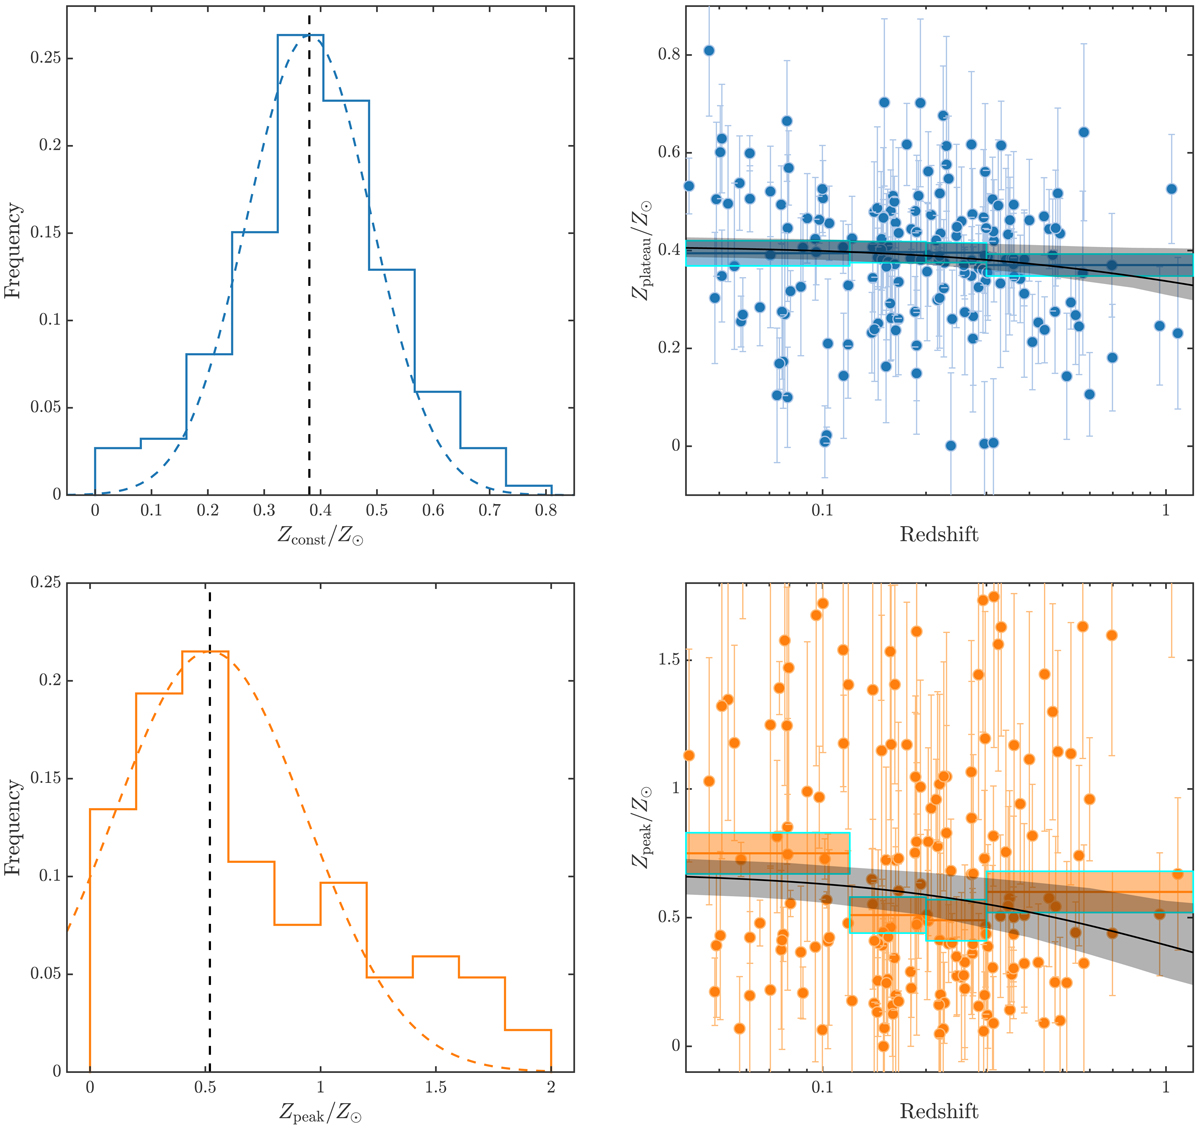
Upper left: distribution of the abundance of the iron plateau component Zplateau. The dashed line indicates the weighted average value ⟨Zplateau⟩ = 0.38 Z⊙. The dashed curve shows a normalized Gaussian with σ = 0.11 Z⊙, corresponding to the average statistical error, and μ = 0.38 Z⊙, corresponding to the weighted average value. Upper right: abundance of the iron plateau plotted against cluster redshift. The black curve and shaded area show the best-fit function Zplateau = Zplateau, 0 ⋅ (1 + z)−γplateau with Zplateau, 0 = (0.41 ± 0.02) Z⊙ and γplateau = 0.21 ± 0.18, which are obtained by fitting the weighted average values and uncertainties of the four bins shown as blue solid lines and shaded areas. Lower left: distribution of the normalization of the iron peak component Zpeak. The dashed line indicates the weighted average value ⟨Zpeak⟩ = 0.52 Z⊙. The dashed curve shows a normalized Gaussian with σ = 0.42 Z⊙, corresponding to the average statistical error, and μ = 0.52 Z⊙, corresponding to the weighted average value. Lower right: normalization of the iron peak component Zpeak plotted against cluster redshift. The black curve and shaded area show the best-fit function Zpeak = Zpeak, 0 ⋅ (1 + z)−γpeak with Zpeak, 0 = (0.68 ± 0.07) Z⊙ and γpeak = 0.79 ± 0.53.
Current usage metrics show cumulative count of Article Views (full-text article views including HTML views, PDF and ePub downloads, according to the available data) and Abstracts Views on Vision4Press platform.
Data correspond to usage on the plateform after 2015. The current usage metrics is available 48-96 hours after online publication and is updated daily on week days.
Initial download of the metrics may take a while.