Fig. 10.
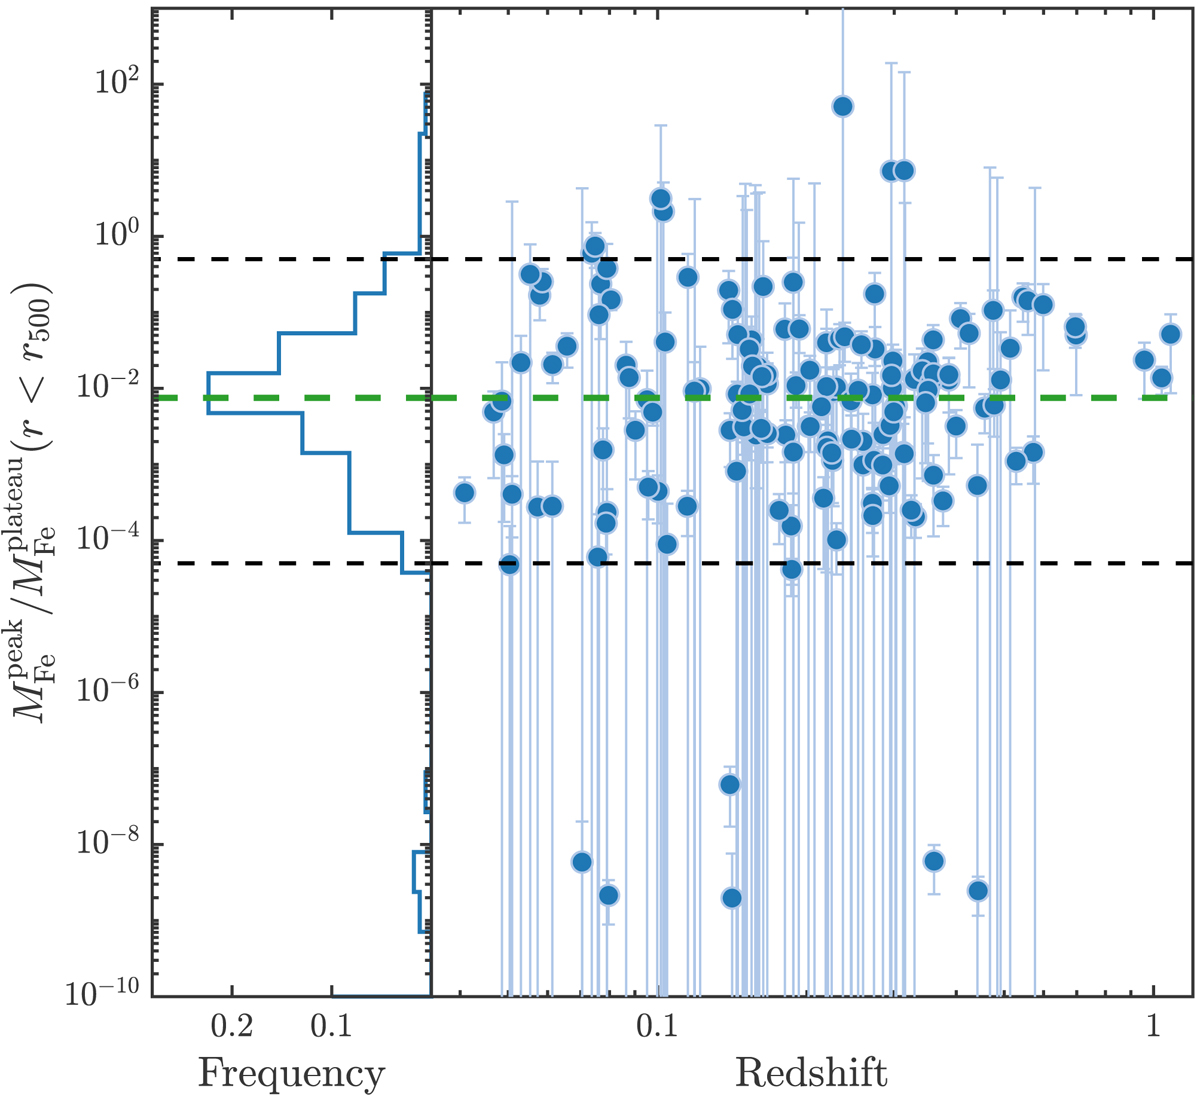
Distribution of the ratio of iron peak mass to iron plateau mass within r500, and the correlation with redshift. The green dashed line indicates the weighted average at ∼0.008. The black dashed lines mark the [5 × 10⁻⁵, 0.5] range roughly corresponding to >90% of the clusters symmetrically distributed around the central value (as shown in the left-side panel).
Current usage metrics show cumulative count of Article Views (full-text article views including HTML views, PDF and ePub downloads, according to the available data) and Abstracts Views on Vision4Press platform.
Data correspond to usage on the plateform after 2015. The current usage metrics is available 48-96 hours after online publication and is updated daily on week days.
Initial download of the metrics may take a while.