Fig. 1.
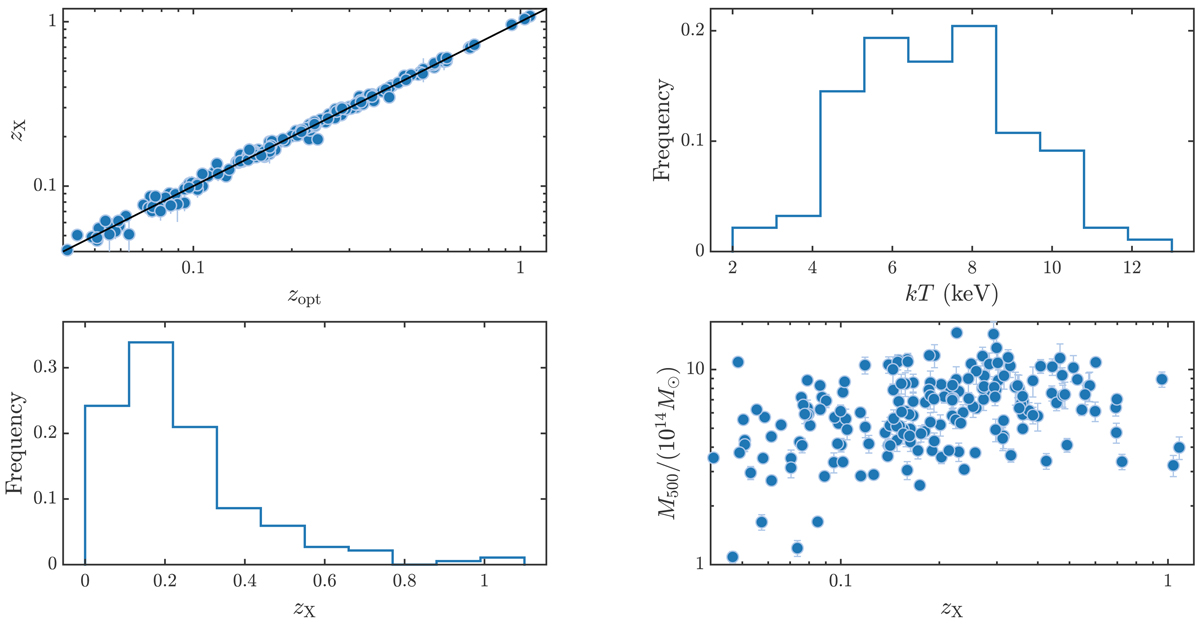
General properties of the cluster sample used in this work (186 clusters). Upper left: X-ray redshift measured in this work compared to the optical redshift from the literature. Lower left: distribution of the redshift of the clusters in our sample. Upper right: distribution of the emission-weighted (spectroscopic-like) temperature in the radial range [0.1, 0.4]r500 across the sample. Lower right: distribution of M500, estimated according to Eq. (3), plotted versus redshift.
Current usage metrics show cumulative count of Article Views (full-text article views including HTML views, PDF and ePub downloads, according to the available data) and Abstracts Views on Vision4Press platform.
Data correspond to usage on the plateform after 2015. The current usage metrics is available 48-96 hours after online publication and is updated daily on week days.
Initial download of the metrics may take a while.