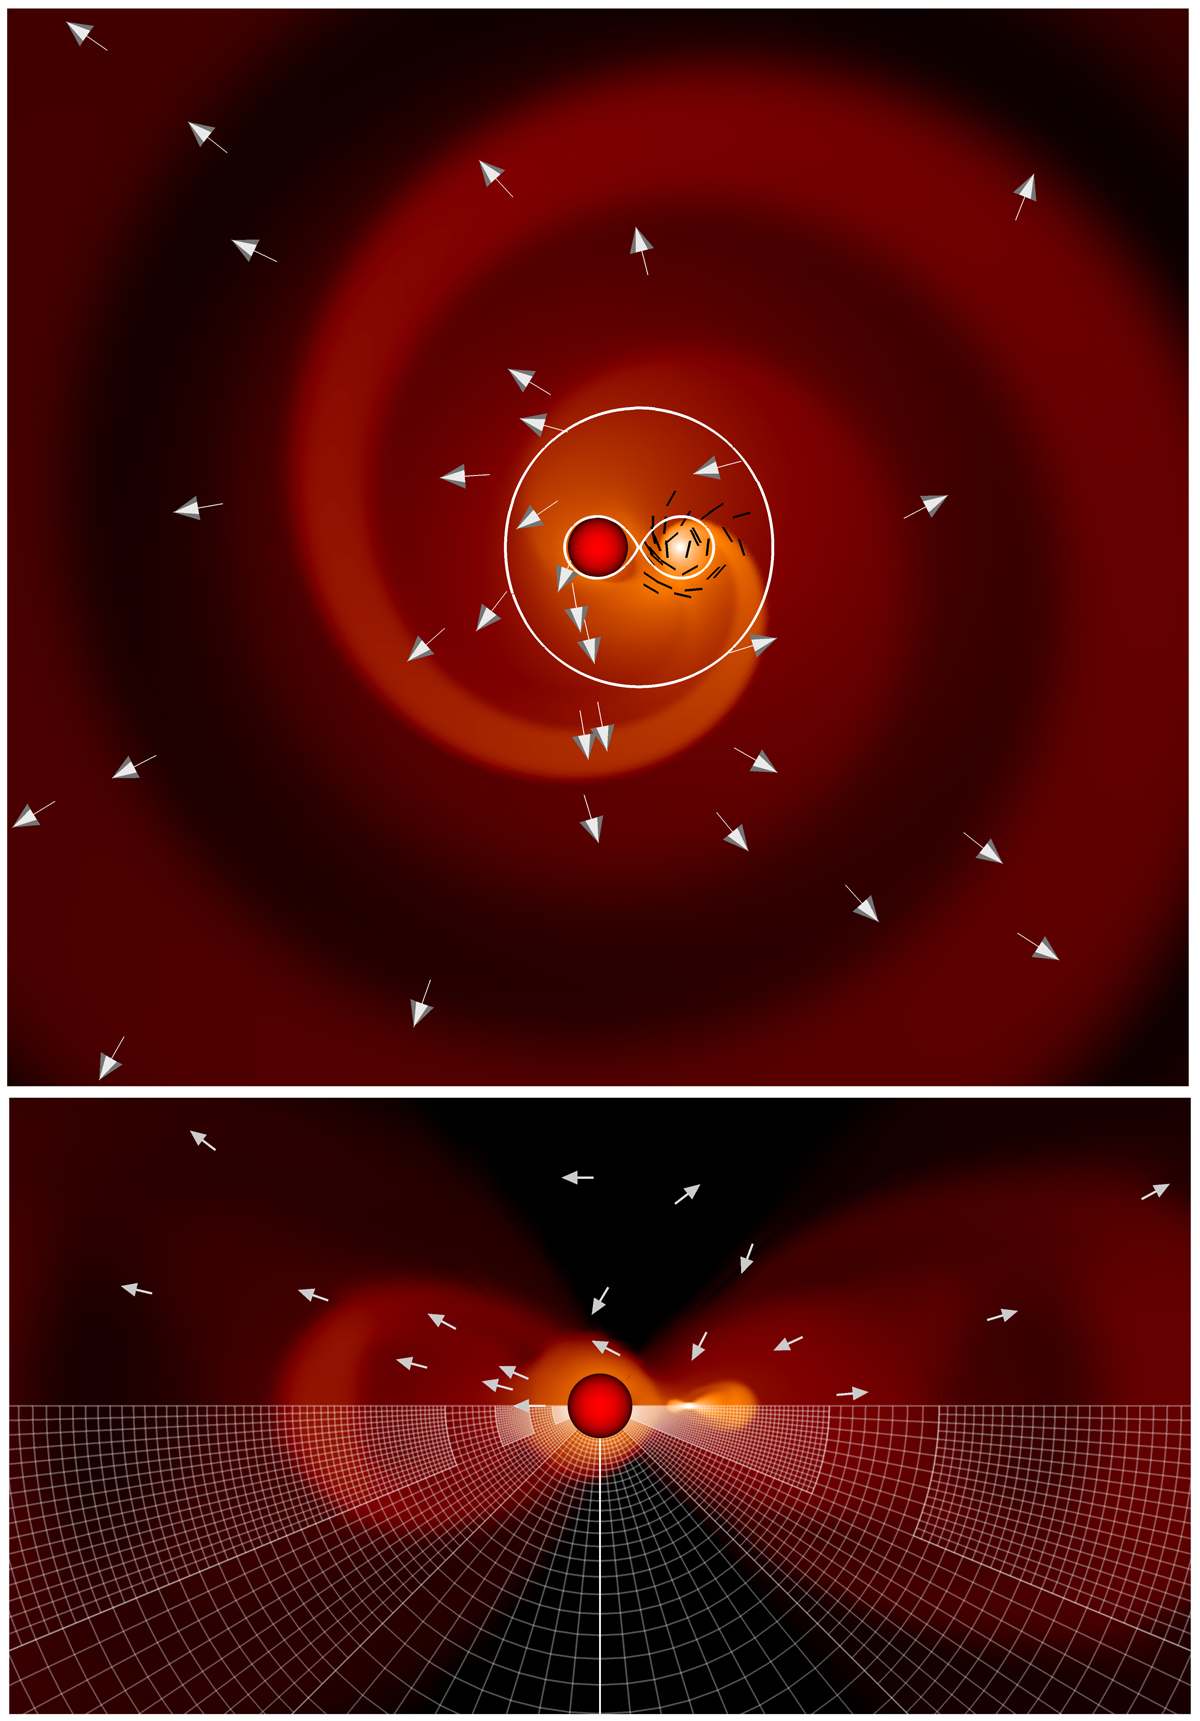
Fig. 9.

Top panel: logarithmic density map in the orbital plane of the innermost region of the wind. The arrows in white represent the velocity field, while the black lines indicate the streamlines in the vicinity of the secondary where a wind-captured disk develops. Solid white represents the contour of the Roche potential with the value at the innermost Lagrangian point. Bottom panel: side-view of the same density map, with the secondary object to the right of the inner boundary (the red sphere of radius 1.2 dust condensation radius). The velocity field is represented in the upper half, while the mesh and its different levels of refinement are visible in the bottom half. This simulation is for an O-rich donor star with q = 1, f = 80%, and η = 0.8.
Current usage metrics show cumulative count of Article Views (full-text article views including HTML views, PDF and ePub downloads, according to the available data) and Abstracts Views on Vision4Press platform.
Data correspond to usage on the plateform after 2015. The current usage metrics is available 48-96 hours after online publication and is updated daily on week days.
Initial download of the metrics may take a while.


