Free Access
Fig. 8.
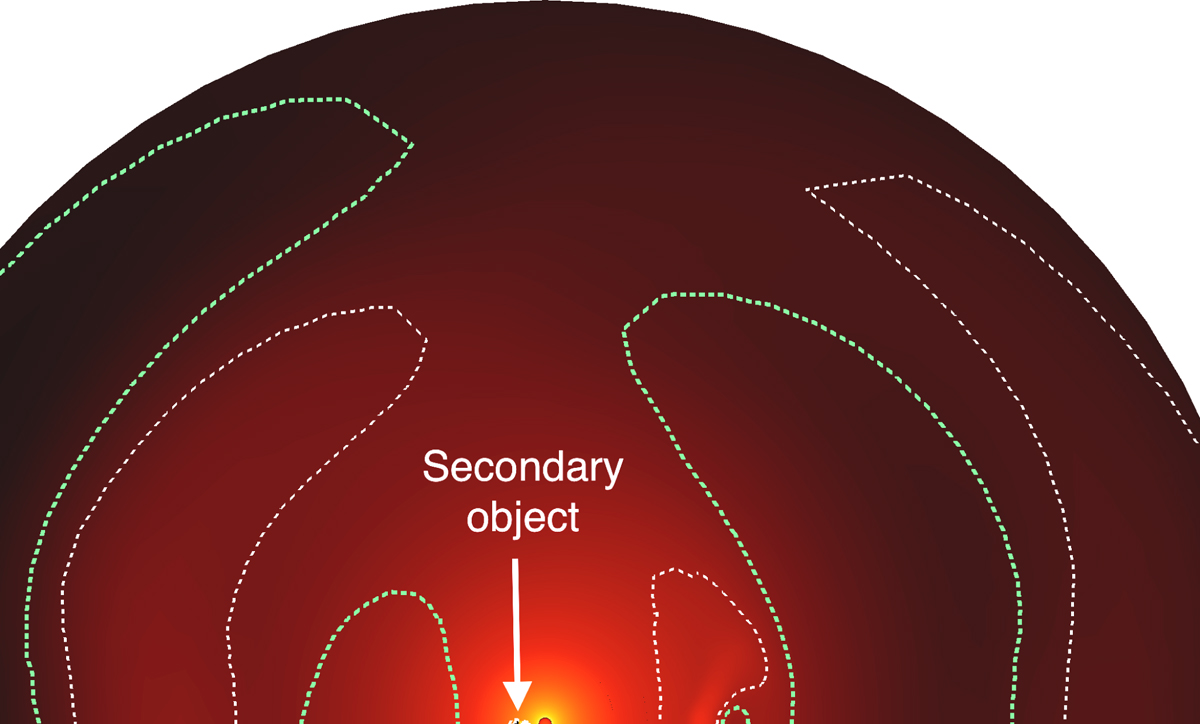
Edge-on view of the simulation in the right panel in Fig. 6. The green and white dashed contours represent 20% deficit and excesses in the local mass-loss rate with respect to the isotropic case, respectively.
Current usage metrics show cumulative count of Article Views (full-text article views including HTML views, PDF and ePub downloads, according to the available data) and Abstracts Views on Vision4Press platform.
Data correspond to usage on the plateform after 2015. The current usage metrics is available 48-96 hours after online publication and is updated daily on week days.
Initial download of the metrics may take a while.