Fig. 6.
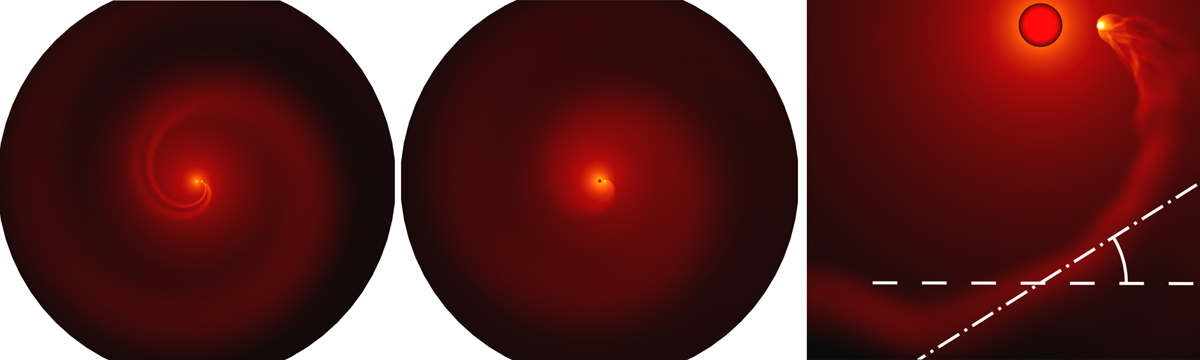
Logarithmic density maps in the orbital plane for three simulations with q = 1 and η = 4. Left panel: C-rich donor star with f = 5%. Center panel: O-rich donor star with f = 80%. Right panel: zoom-in on a C-rich donor star with f = 80%. The white dashed line represents the local tangent to the circle centered on the donor star, while the white dot-dashed line is the local tangent to the spiral shock. Zoom-in for the left and center panels and a zoom-out for the right panel are available in Appendix C. The outer edge of the simulation space lies at 40 orbital separations away from the donor star.
Current usage metrics show cumulative count of Article Views (full-text article views including HTML views, PDF and ePub downloads, according to the available data) and Abstracts Views on Vision4Press platform.
Data correspond to usage on the plateform after 2015. The current usage metrics is available 48-96 hours after online publication and is updated daily on week days.
Initial download of the metrics may take a while.