Fig. 3.
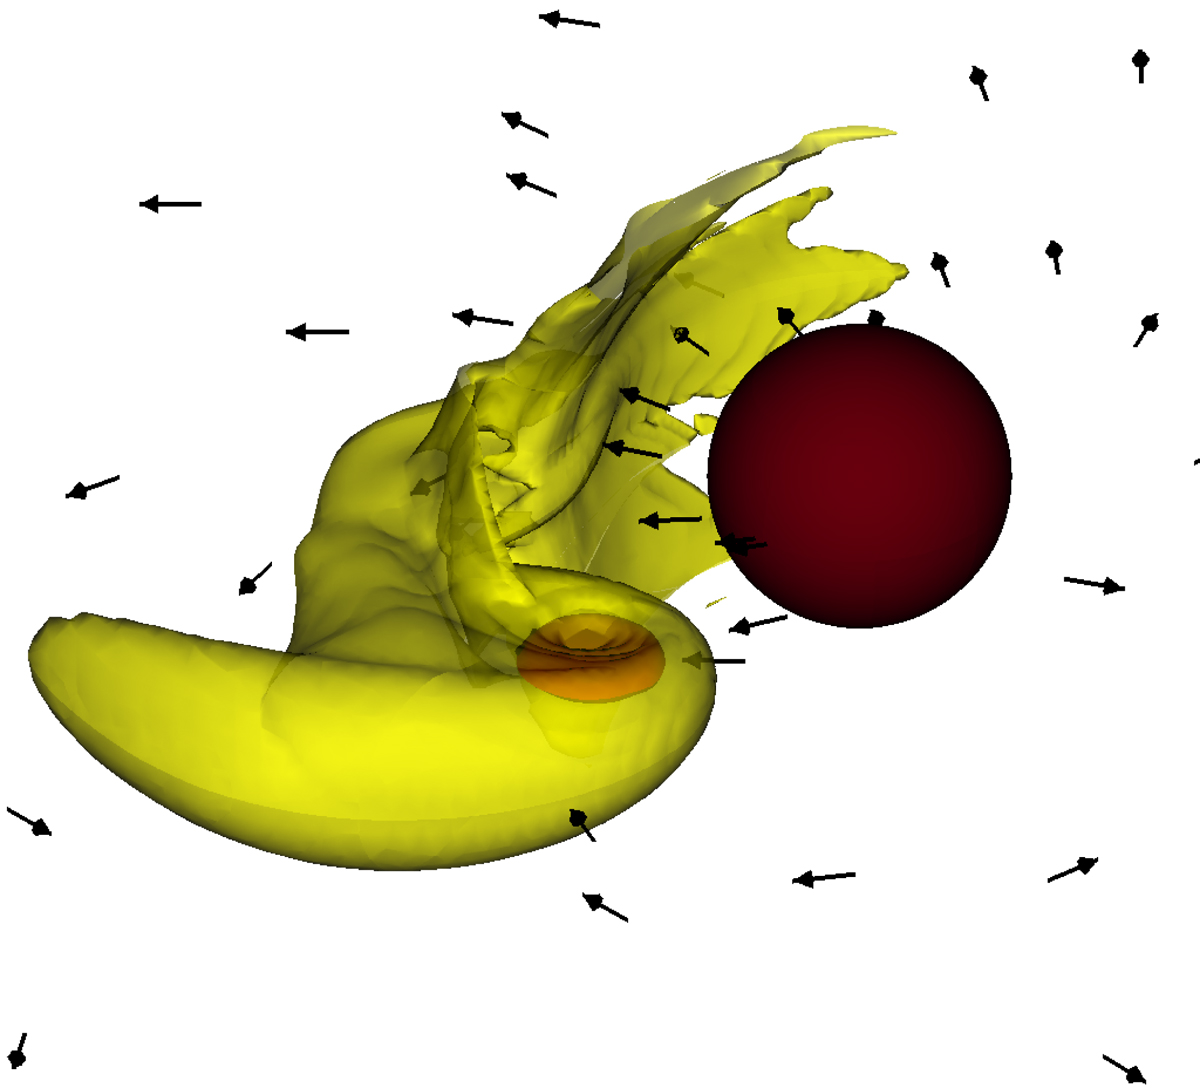
Zoom-in on the central region in Fig. 2 (black frame) where the donor is a C-rich star and q = 1, f = 80%, and η = 0.8. For Rd = 6 au and Ṁ1 = 3 × 10⁻⁵ M⊙ yr−1, semitransparent yellow represents the 3D iso-density surface ρ = 9 × 10⁻¹⁴ g cm−3 and red corresponds to the surface ρ = 9 × 10⁻¹² g cm−3. The inner boundary of the simulation space is visible in dark red in the right part and the velocity field in the orbital plane is represented.
Current usage metrics show cumulative count of Article Views (full-text article views including HTML views, PDF and ePub downloads, according to the available data) and Abstracts Views on Vision4Press platform.
Data correspond to usage on the plateform after 2015. The current usage metrics is available 48-96 hours after online publication and is updated daily on week days.
Initial download of the metrics may take a while.